JT-PROXENSE
Dashboard
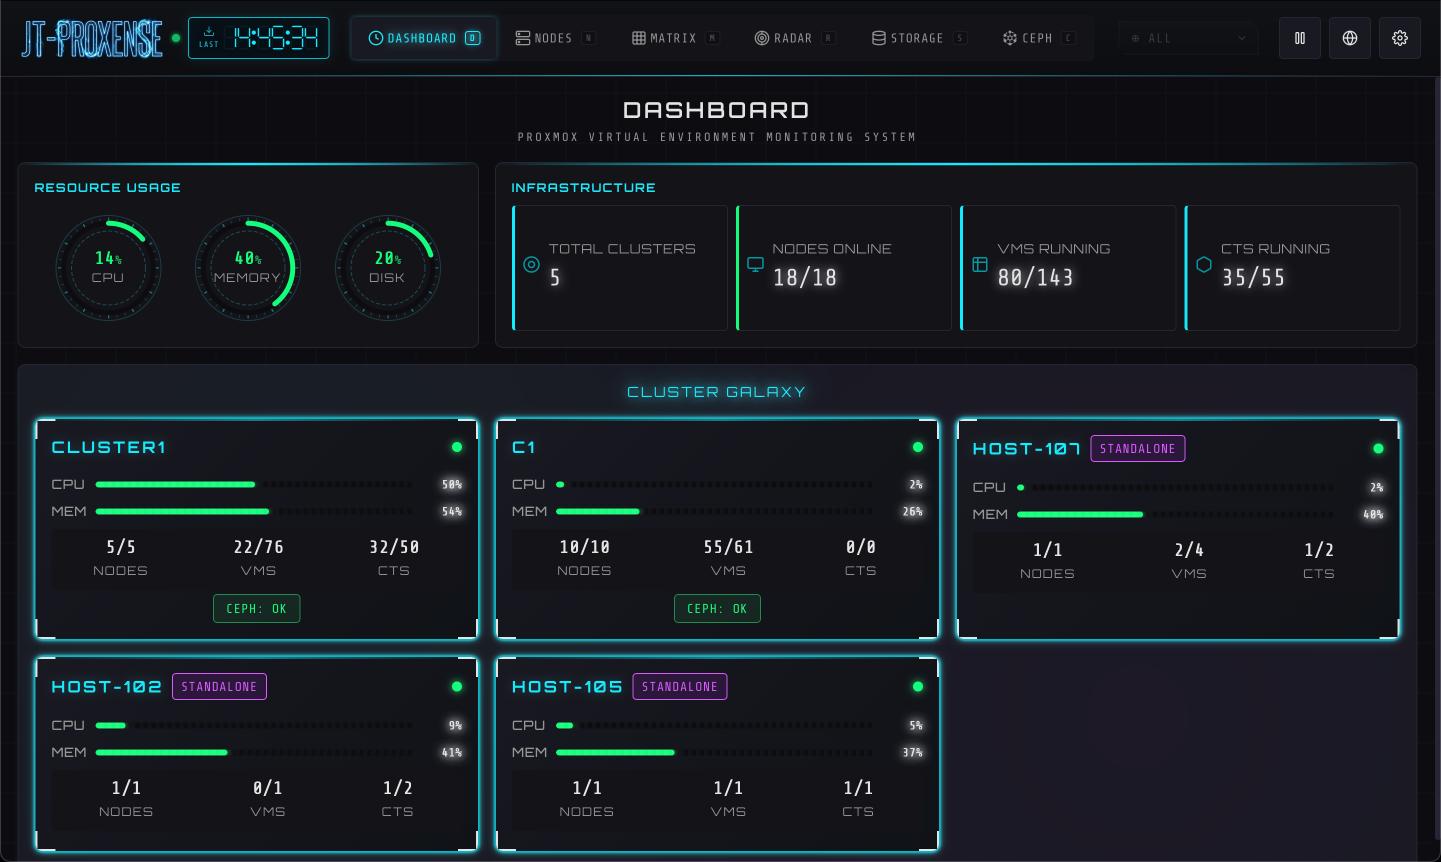
Global overview. Resource gauges, infrastructure totals, and per-cluster health at a glance.
Real-time Proxmox VE monitoring with a sci-fi cyberpunk UI. Six views over VMs, containers, nodes, storage, and Ceph — with API failover across nodes, on a single Linux box.
The installer creates a dedicated jt-proxense user, drops a hardened systemd unit, and starts the service.
Requires sudo and Python 3.10+.
http://<your-server>:8098/.
Re-run the installer — idempotent, config and data are preserved.
Removes the service, program and data completely (irreversible).
Export one encrypted bundle (config, database, keys) on the old host → install on the new host, then import.
Music: “Heroic Age” Kevin MacLeod (incompetech.com), licensed under Creative Commons: By Attribution 4.0.
Switch between views with a keystroke — each a different lens on the same live state. When you need to act, the controls are in the same place, behind the same auth and audit trail.
Global overview. Resource gauges, infrastructure totals, and per-cluster health at a glance.
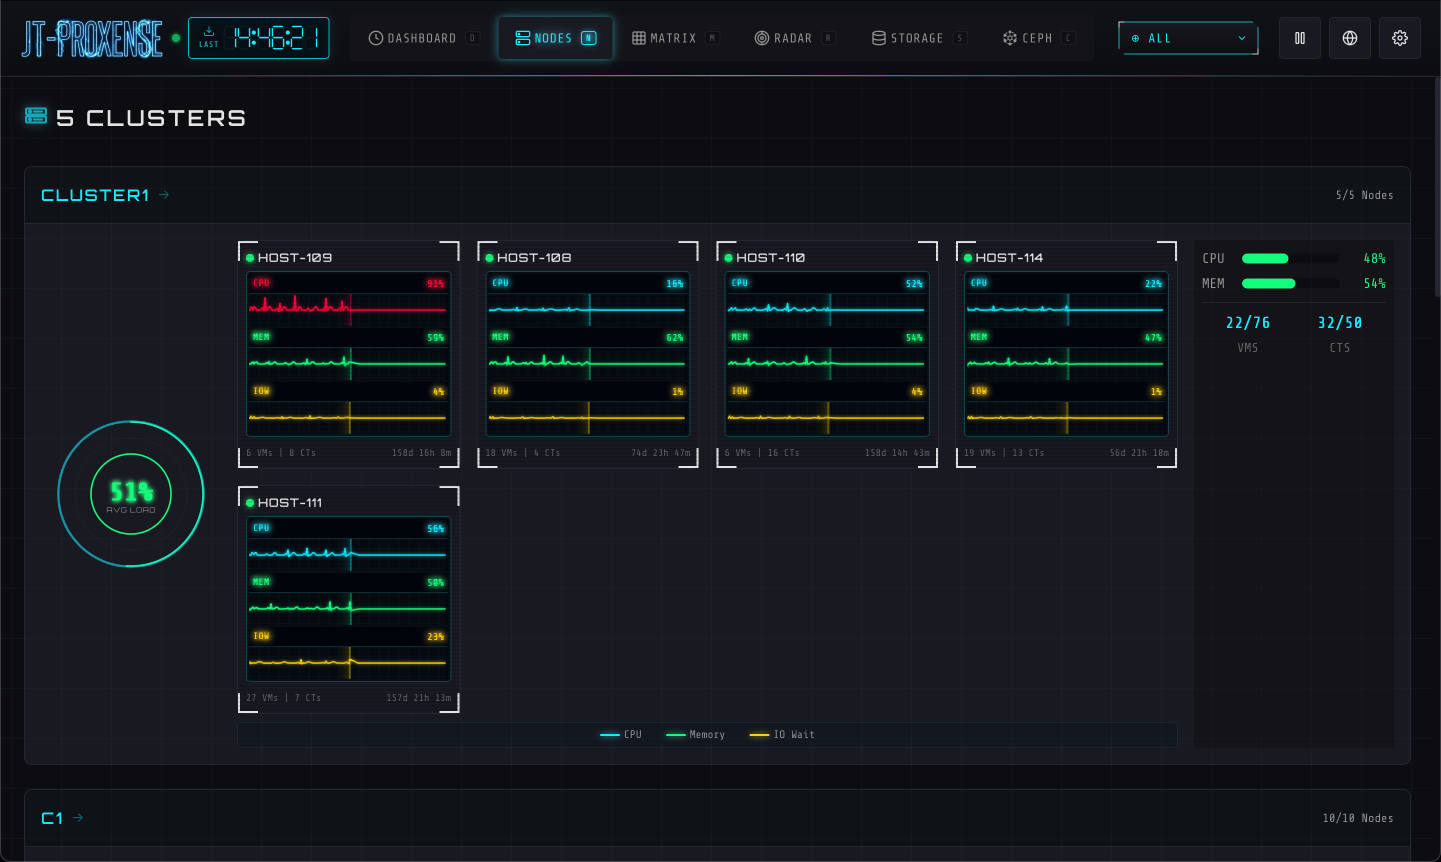
ECG-style metric monitors per node. CPU / memory / I/O traced as live waveforms.
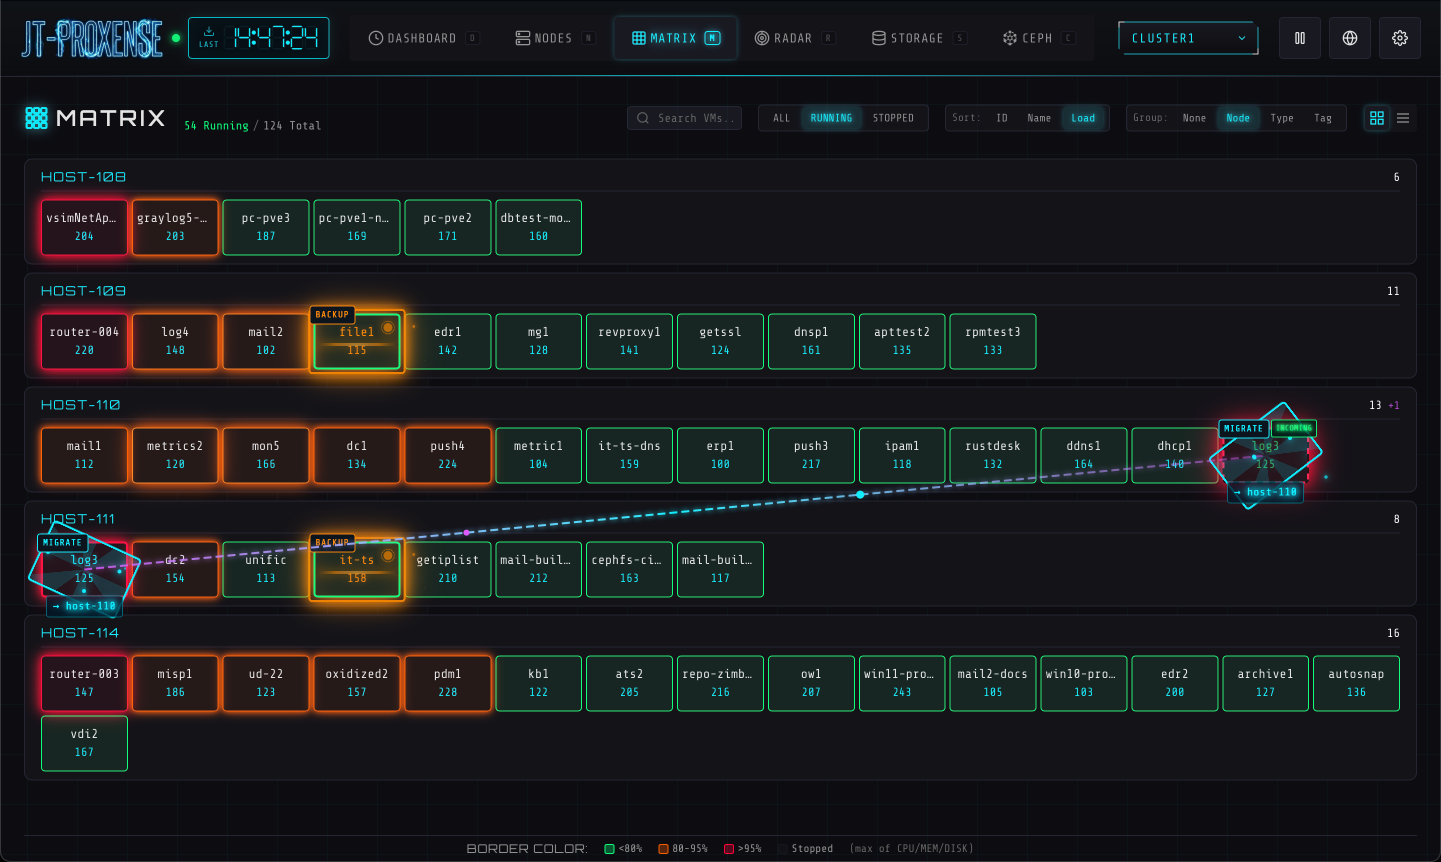
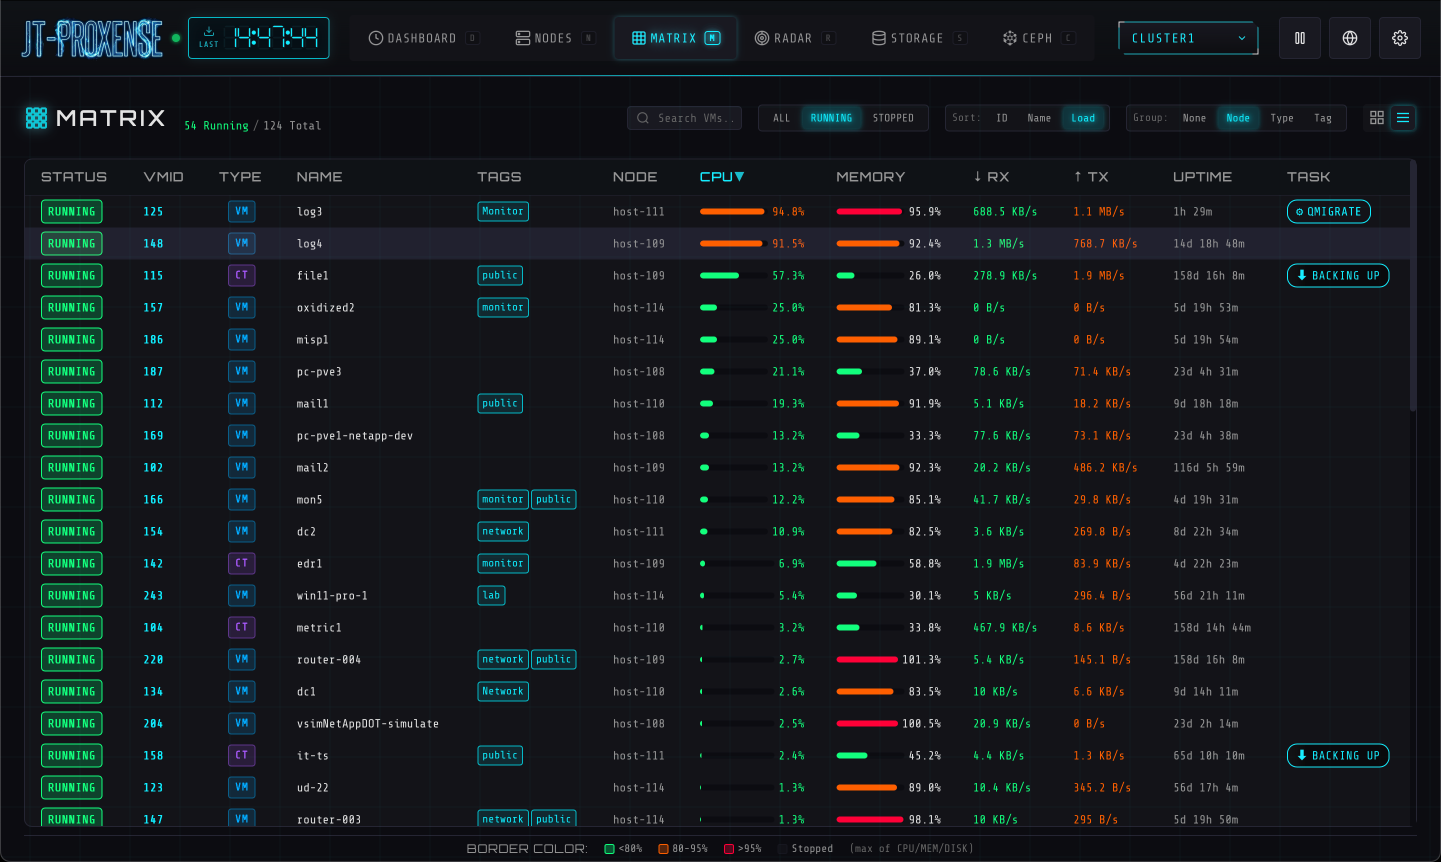
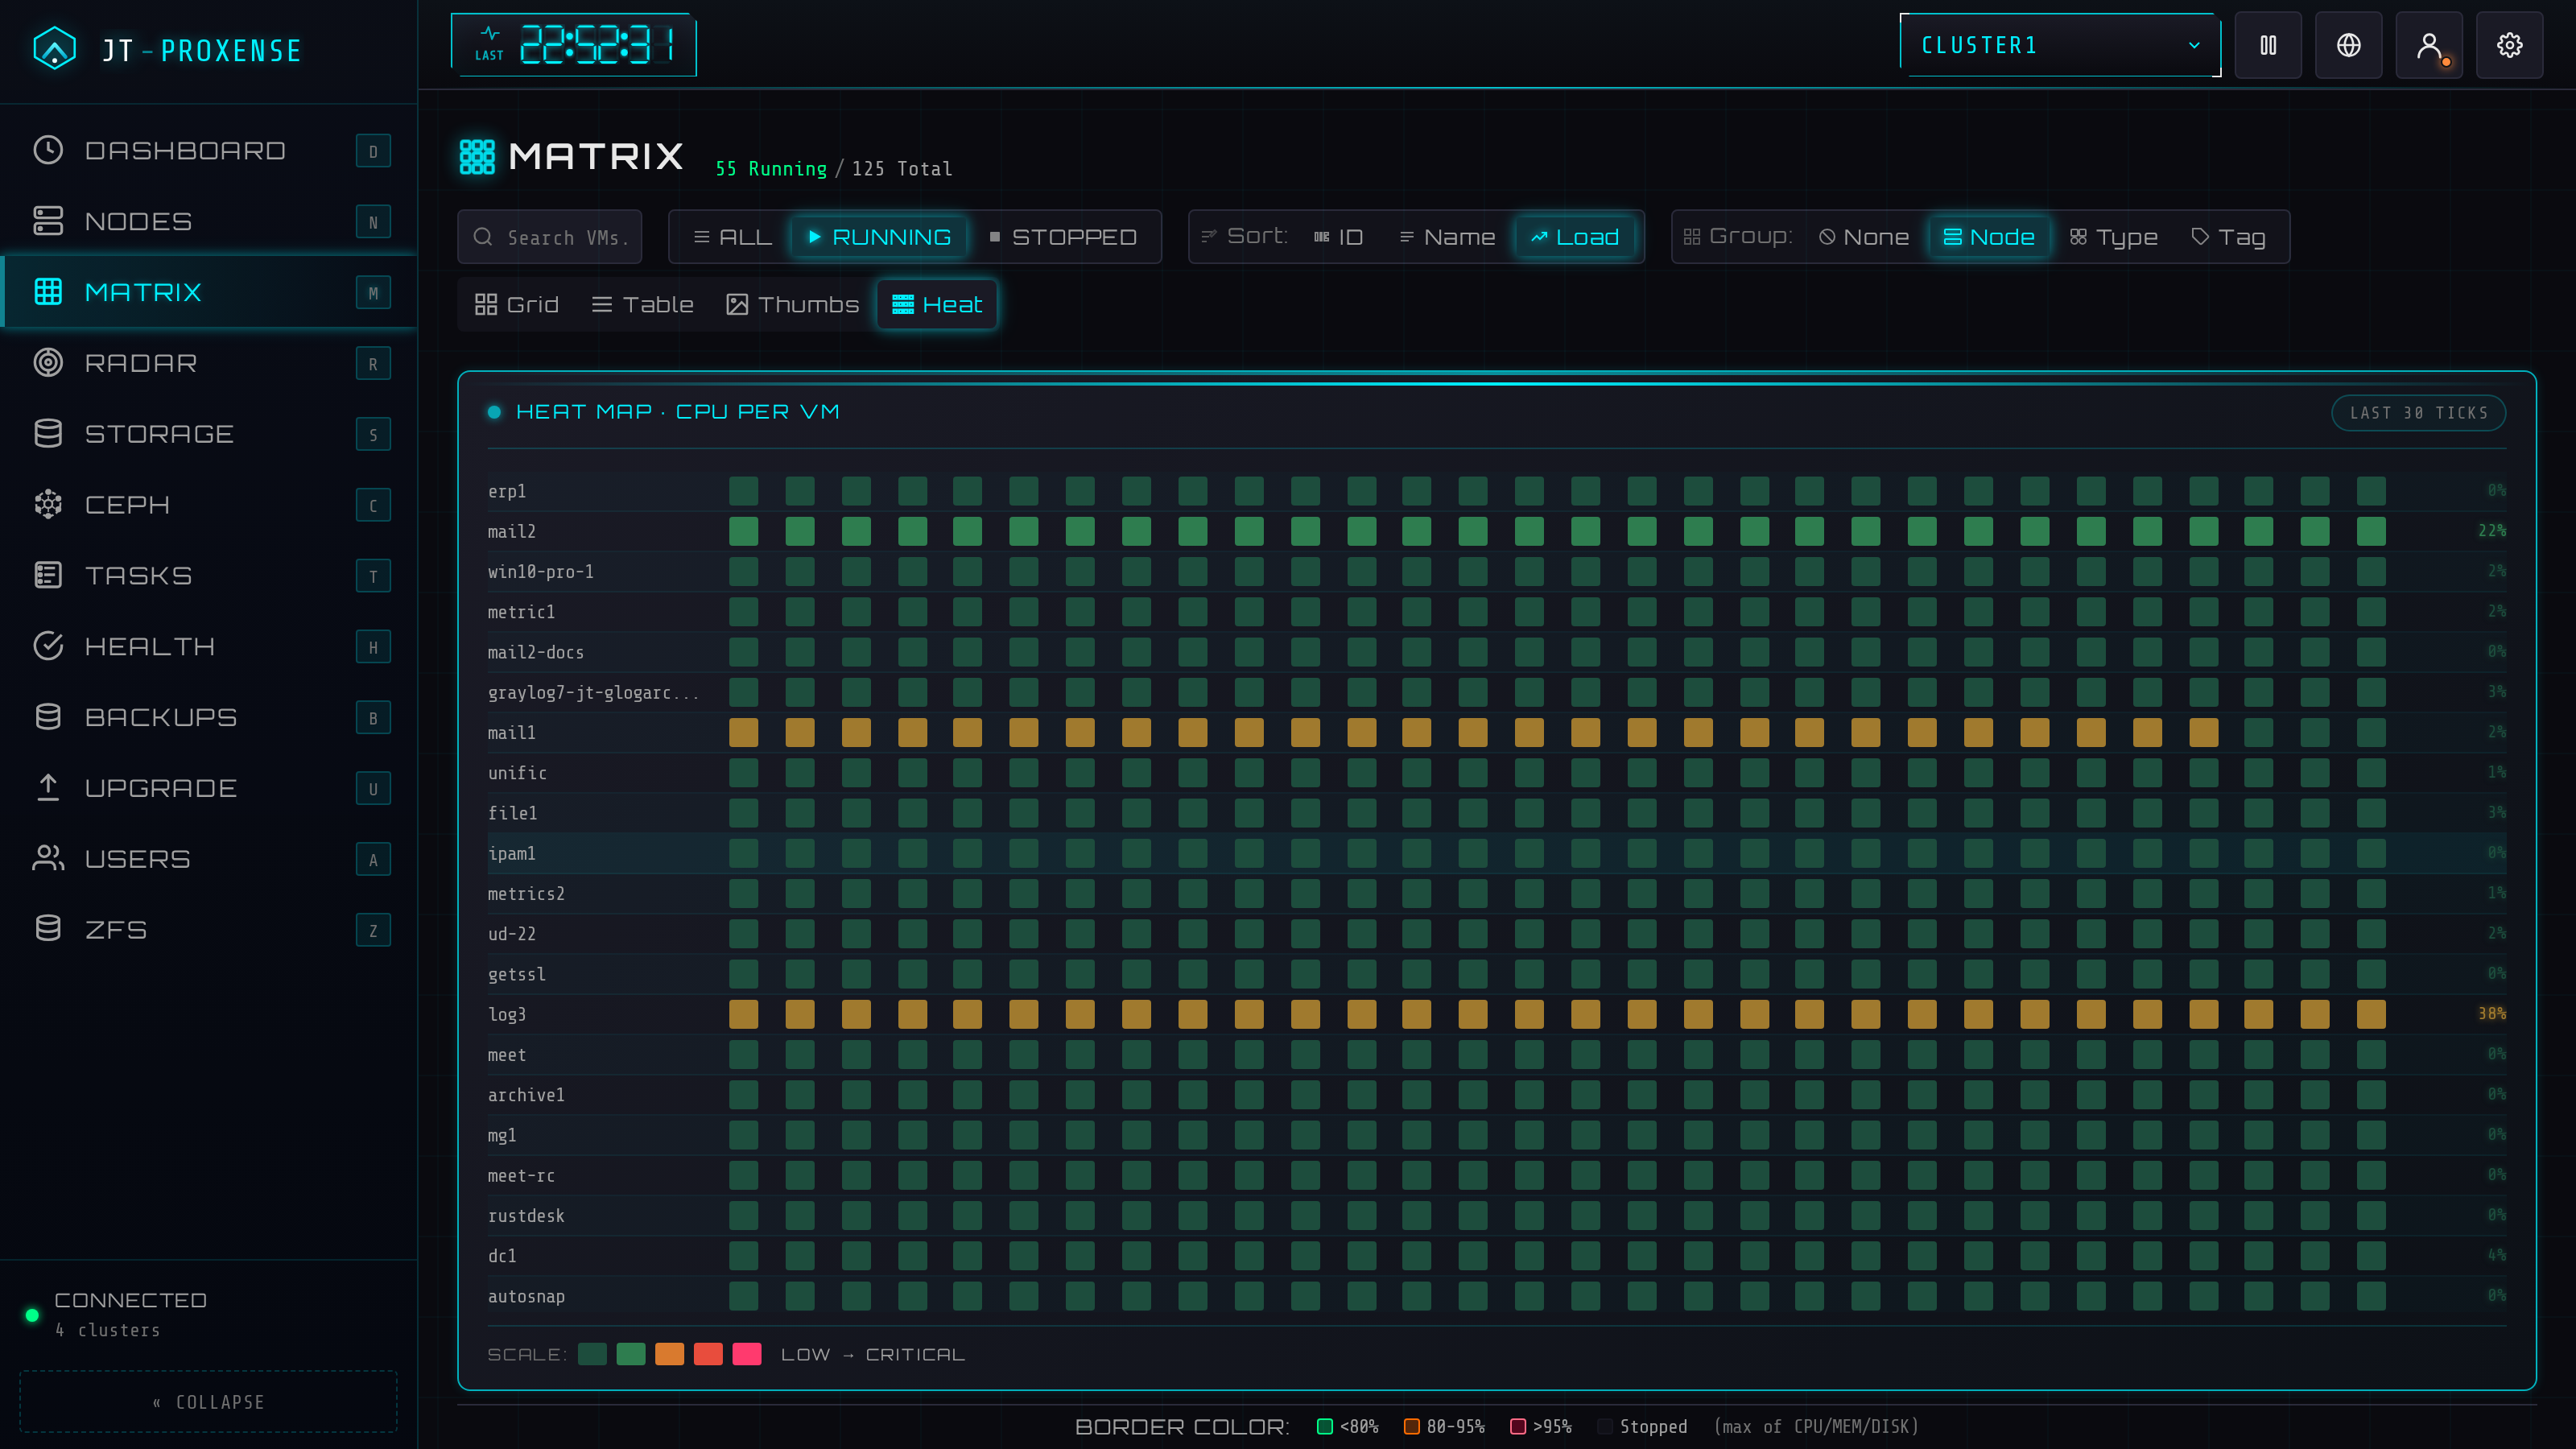
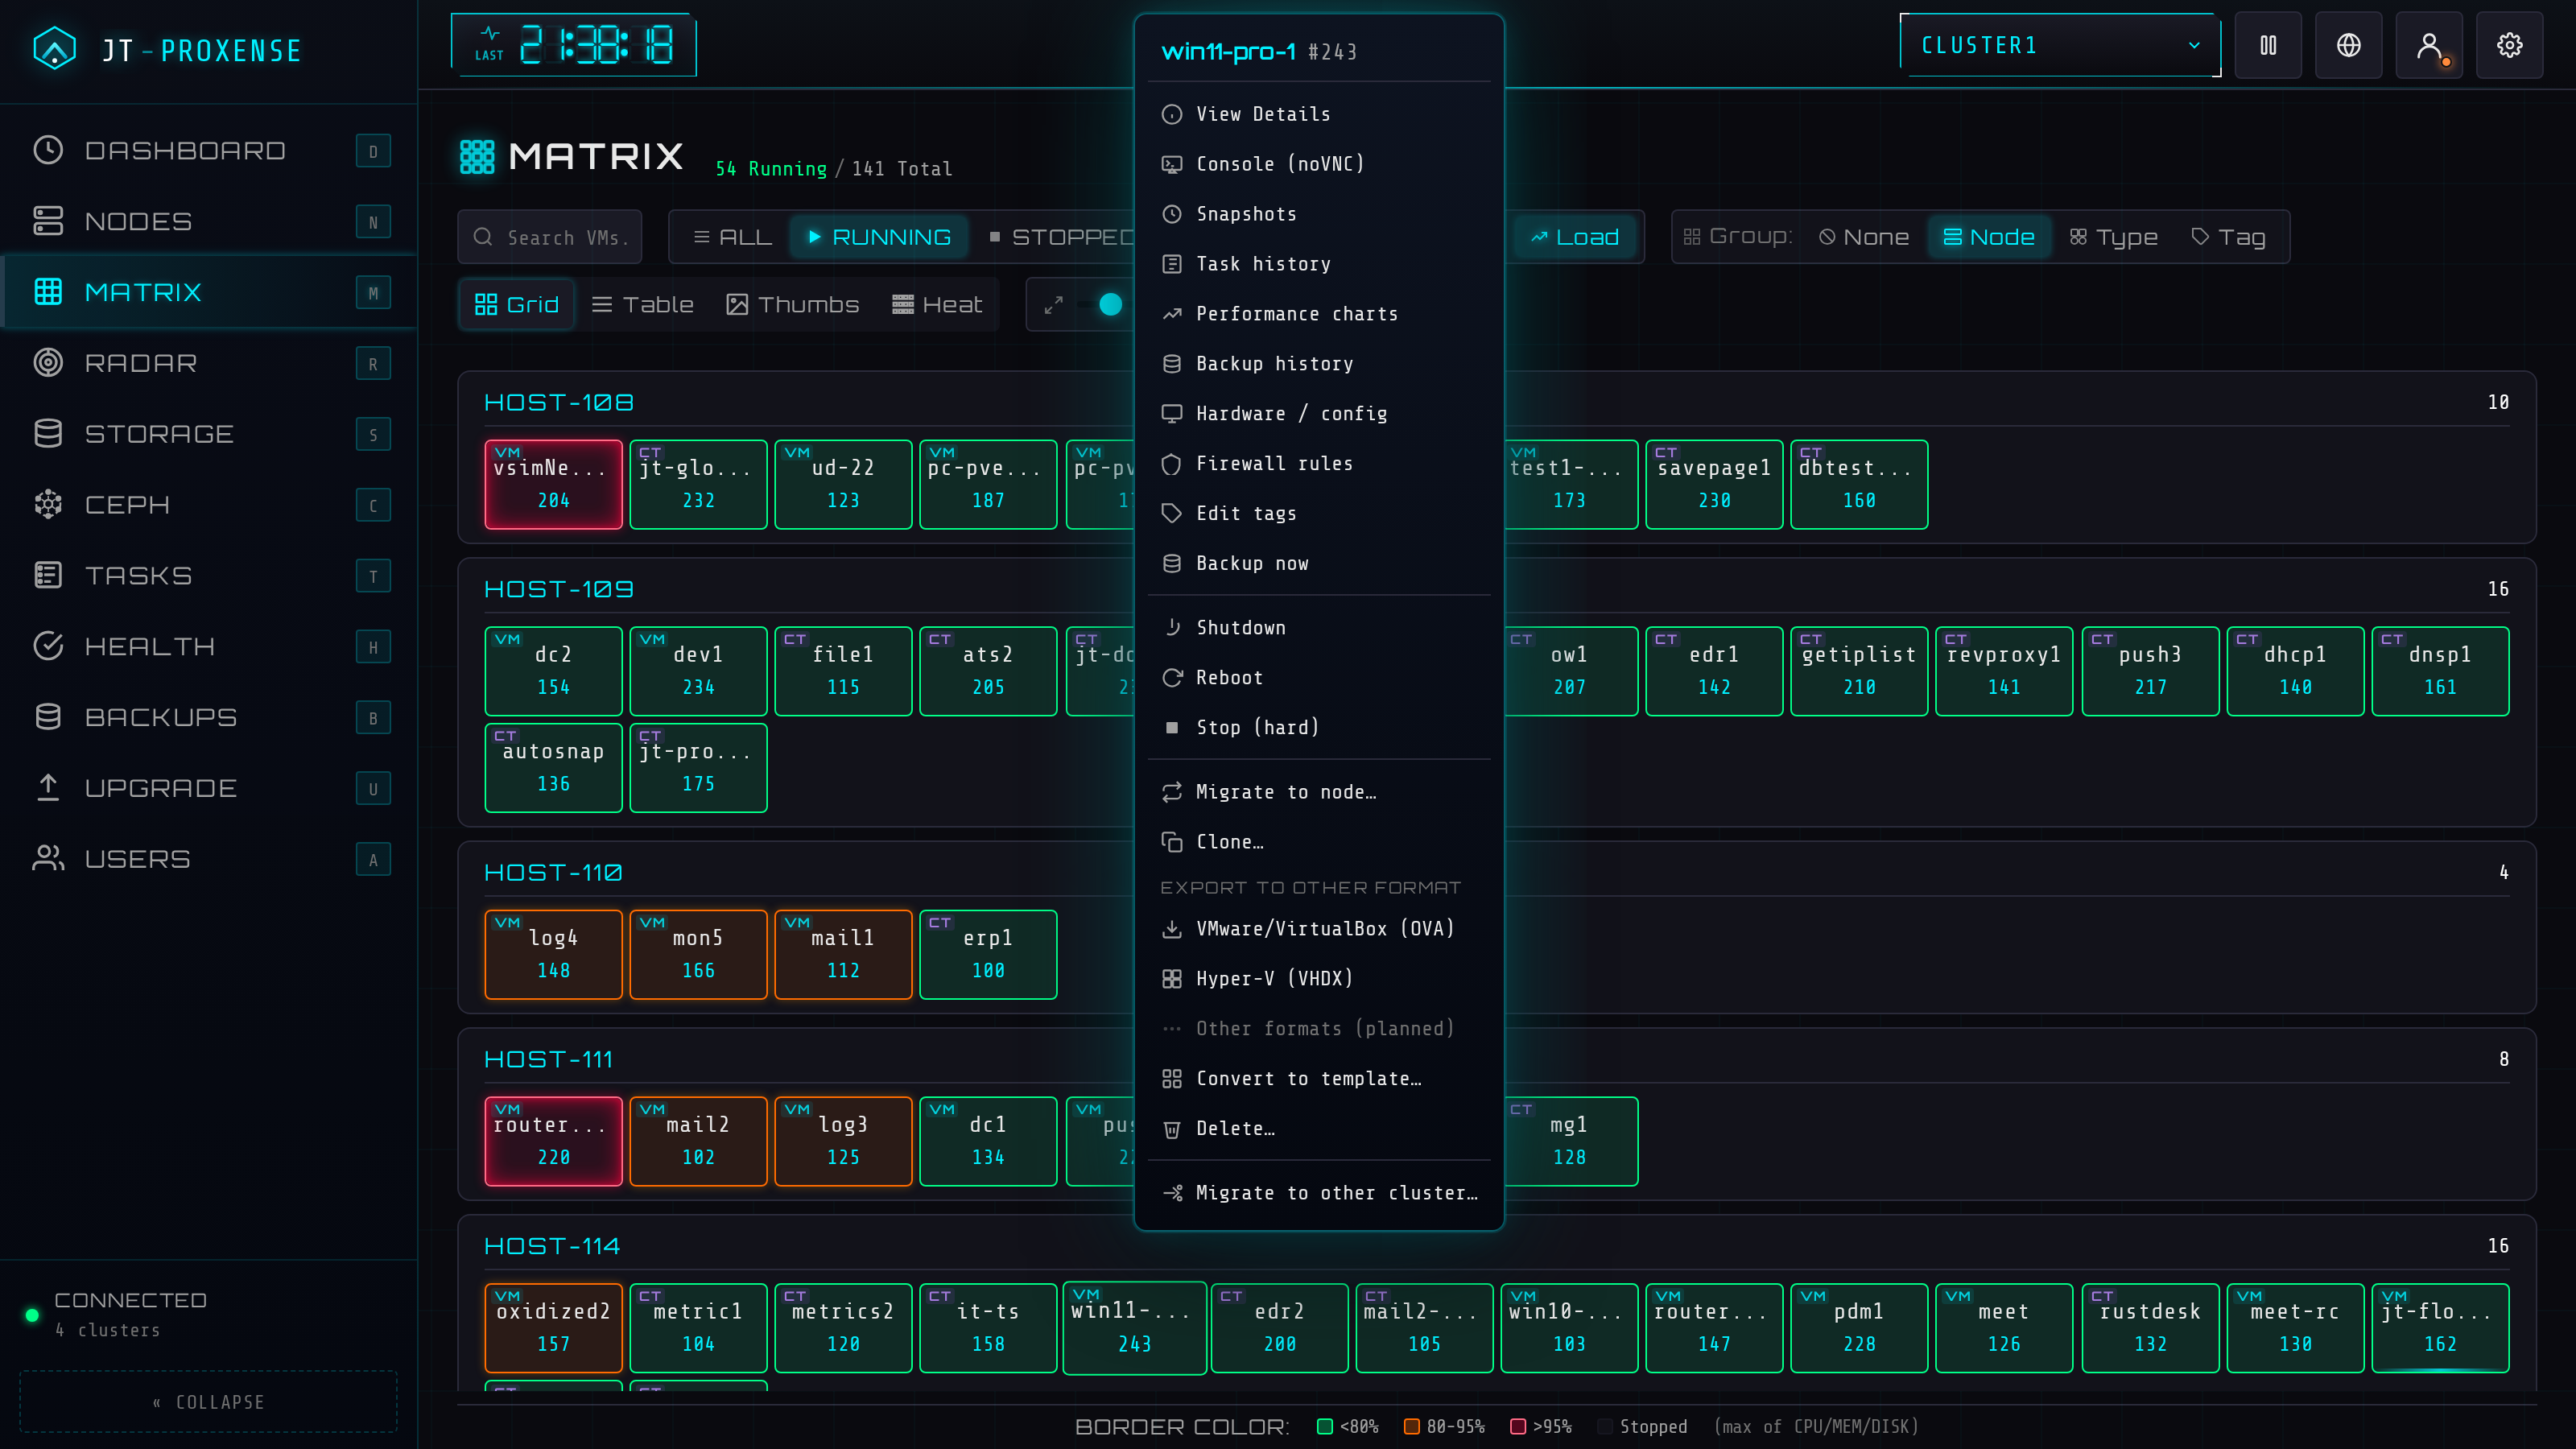
Every VM as a coloured tile. Filter by state, sort by load, group by node — at any density.
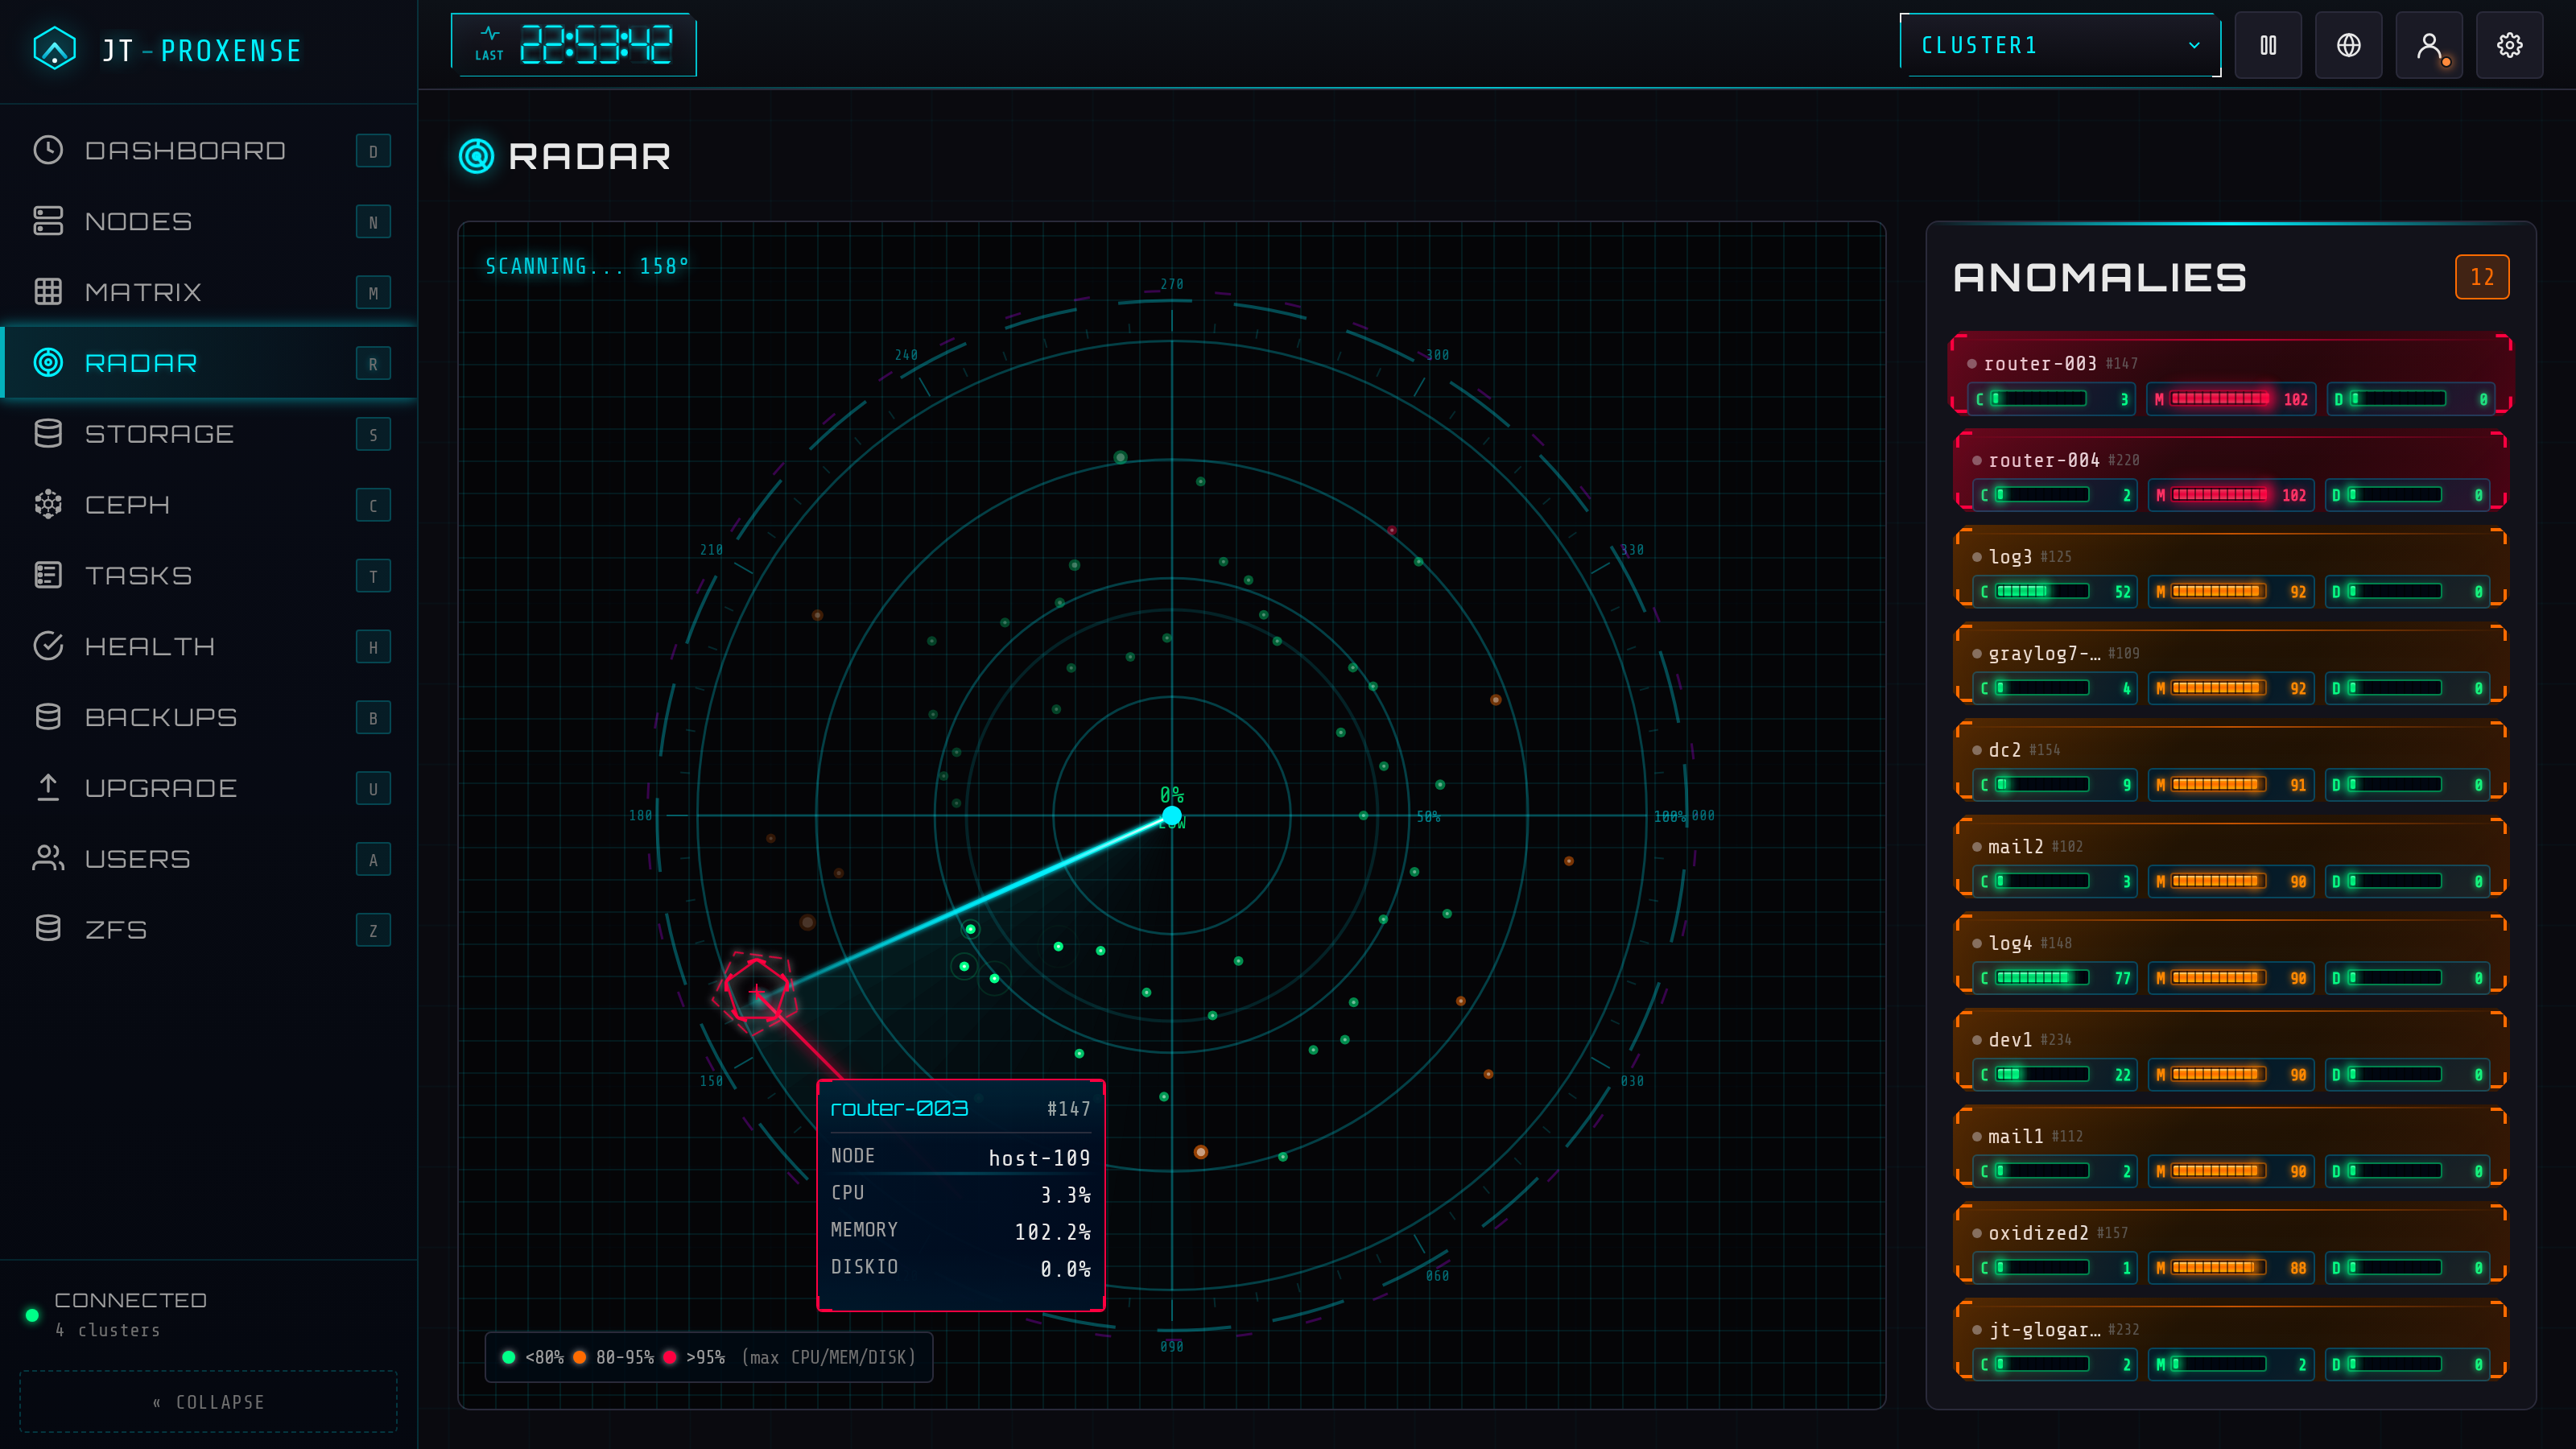
Anomaly-detection radar. Spikes, threshold breaches, and offline nodes pop into view.
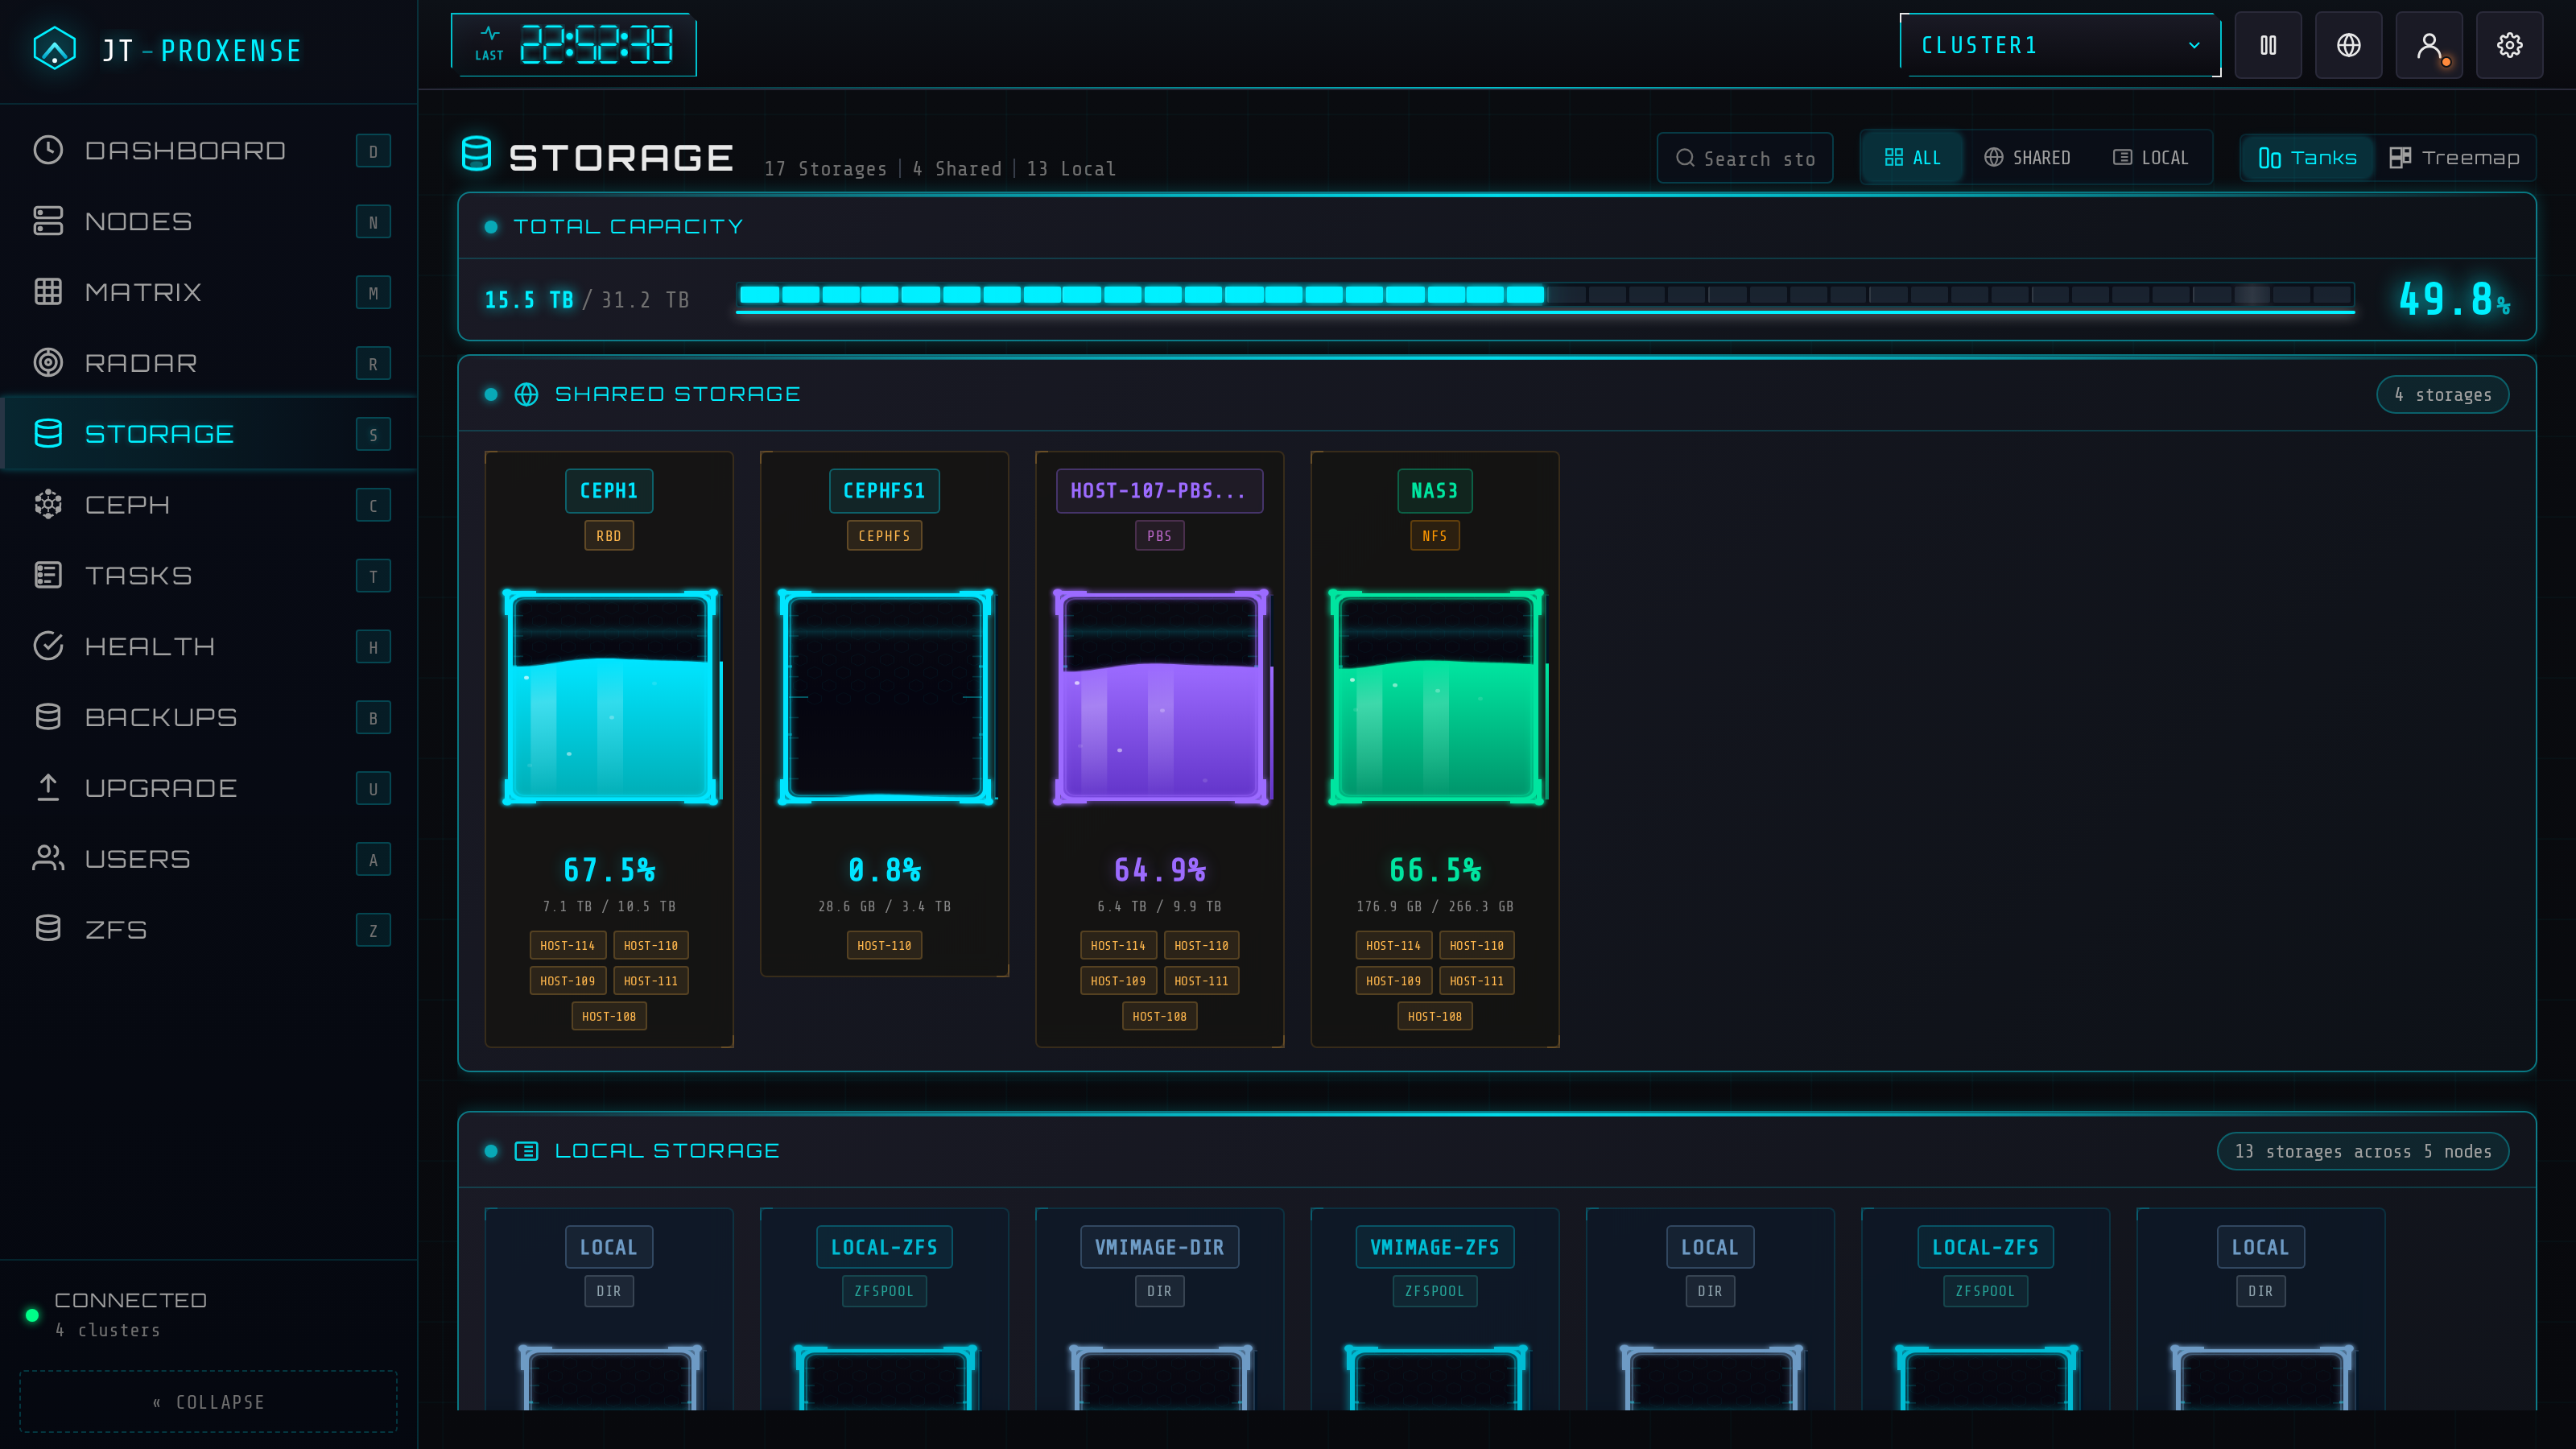
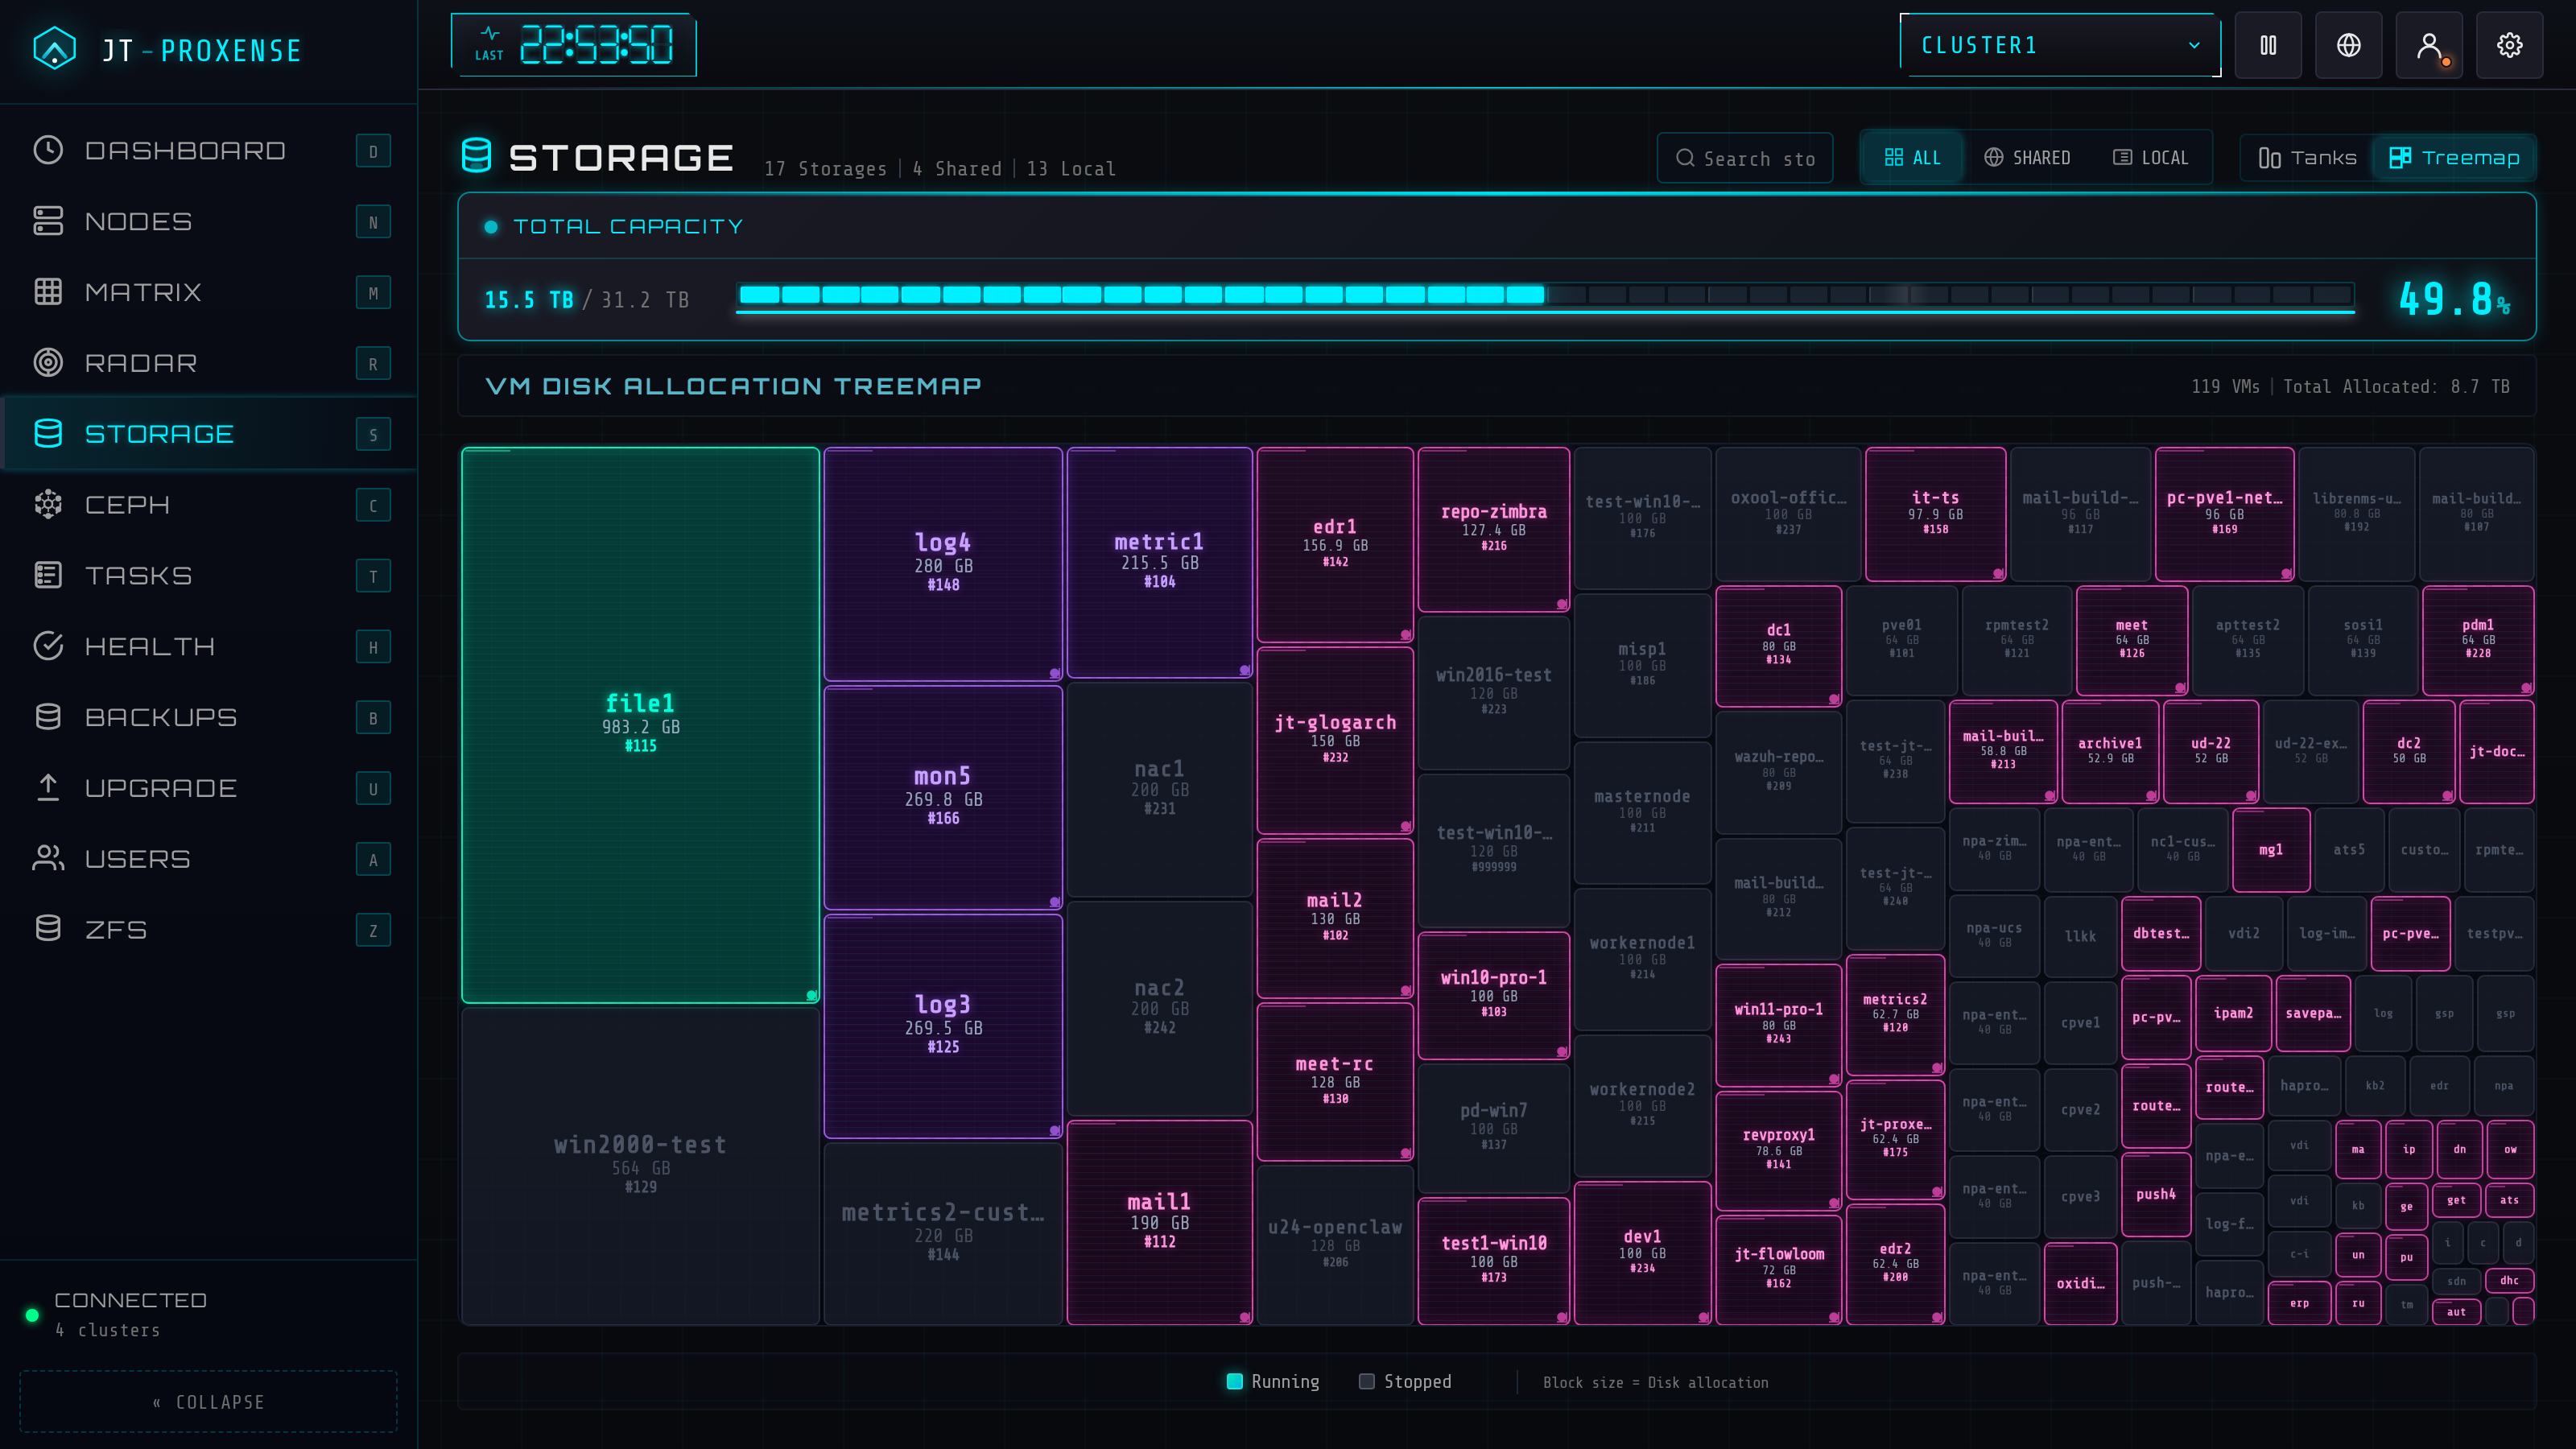
Treemap of every storage pool, sized by capacity, coloured by usage. Pressure becomes visible.
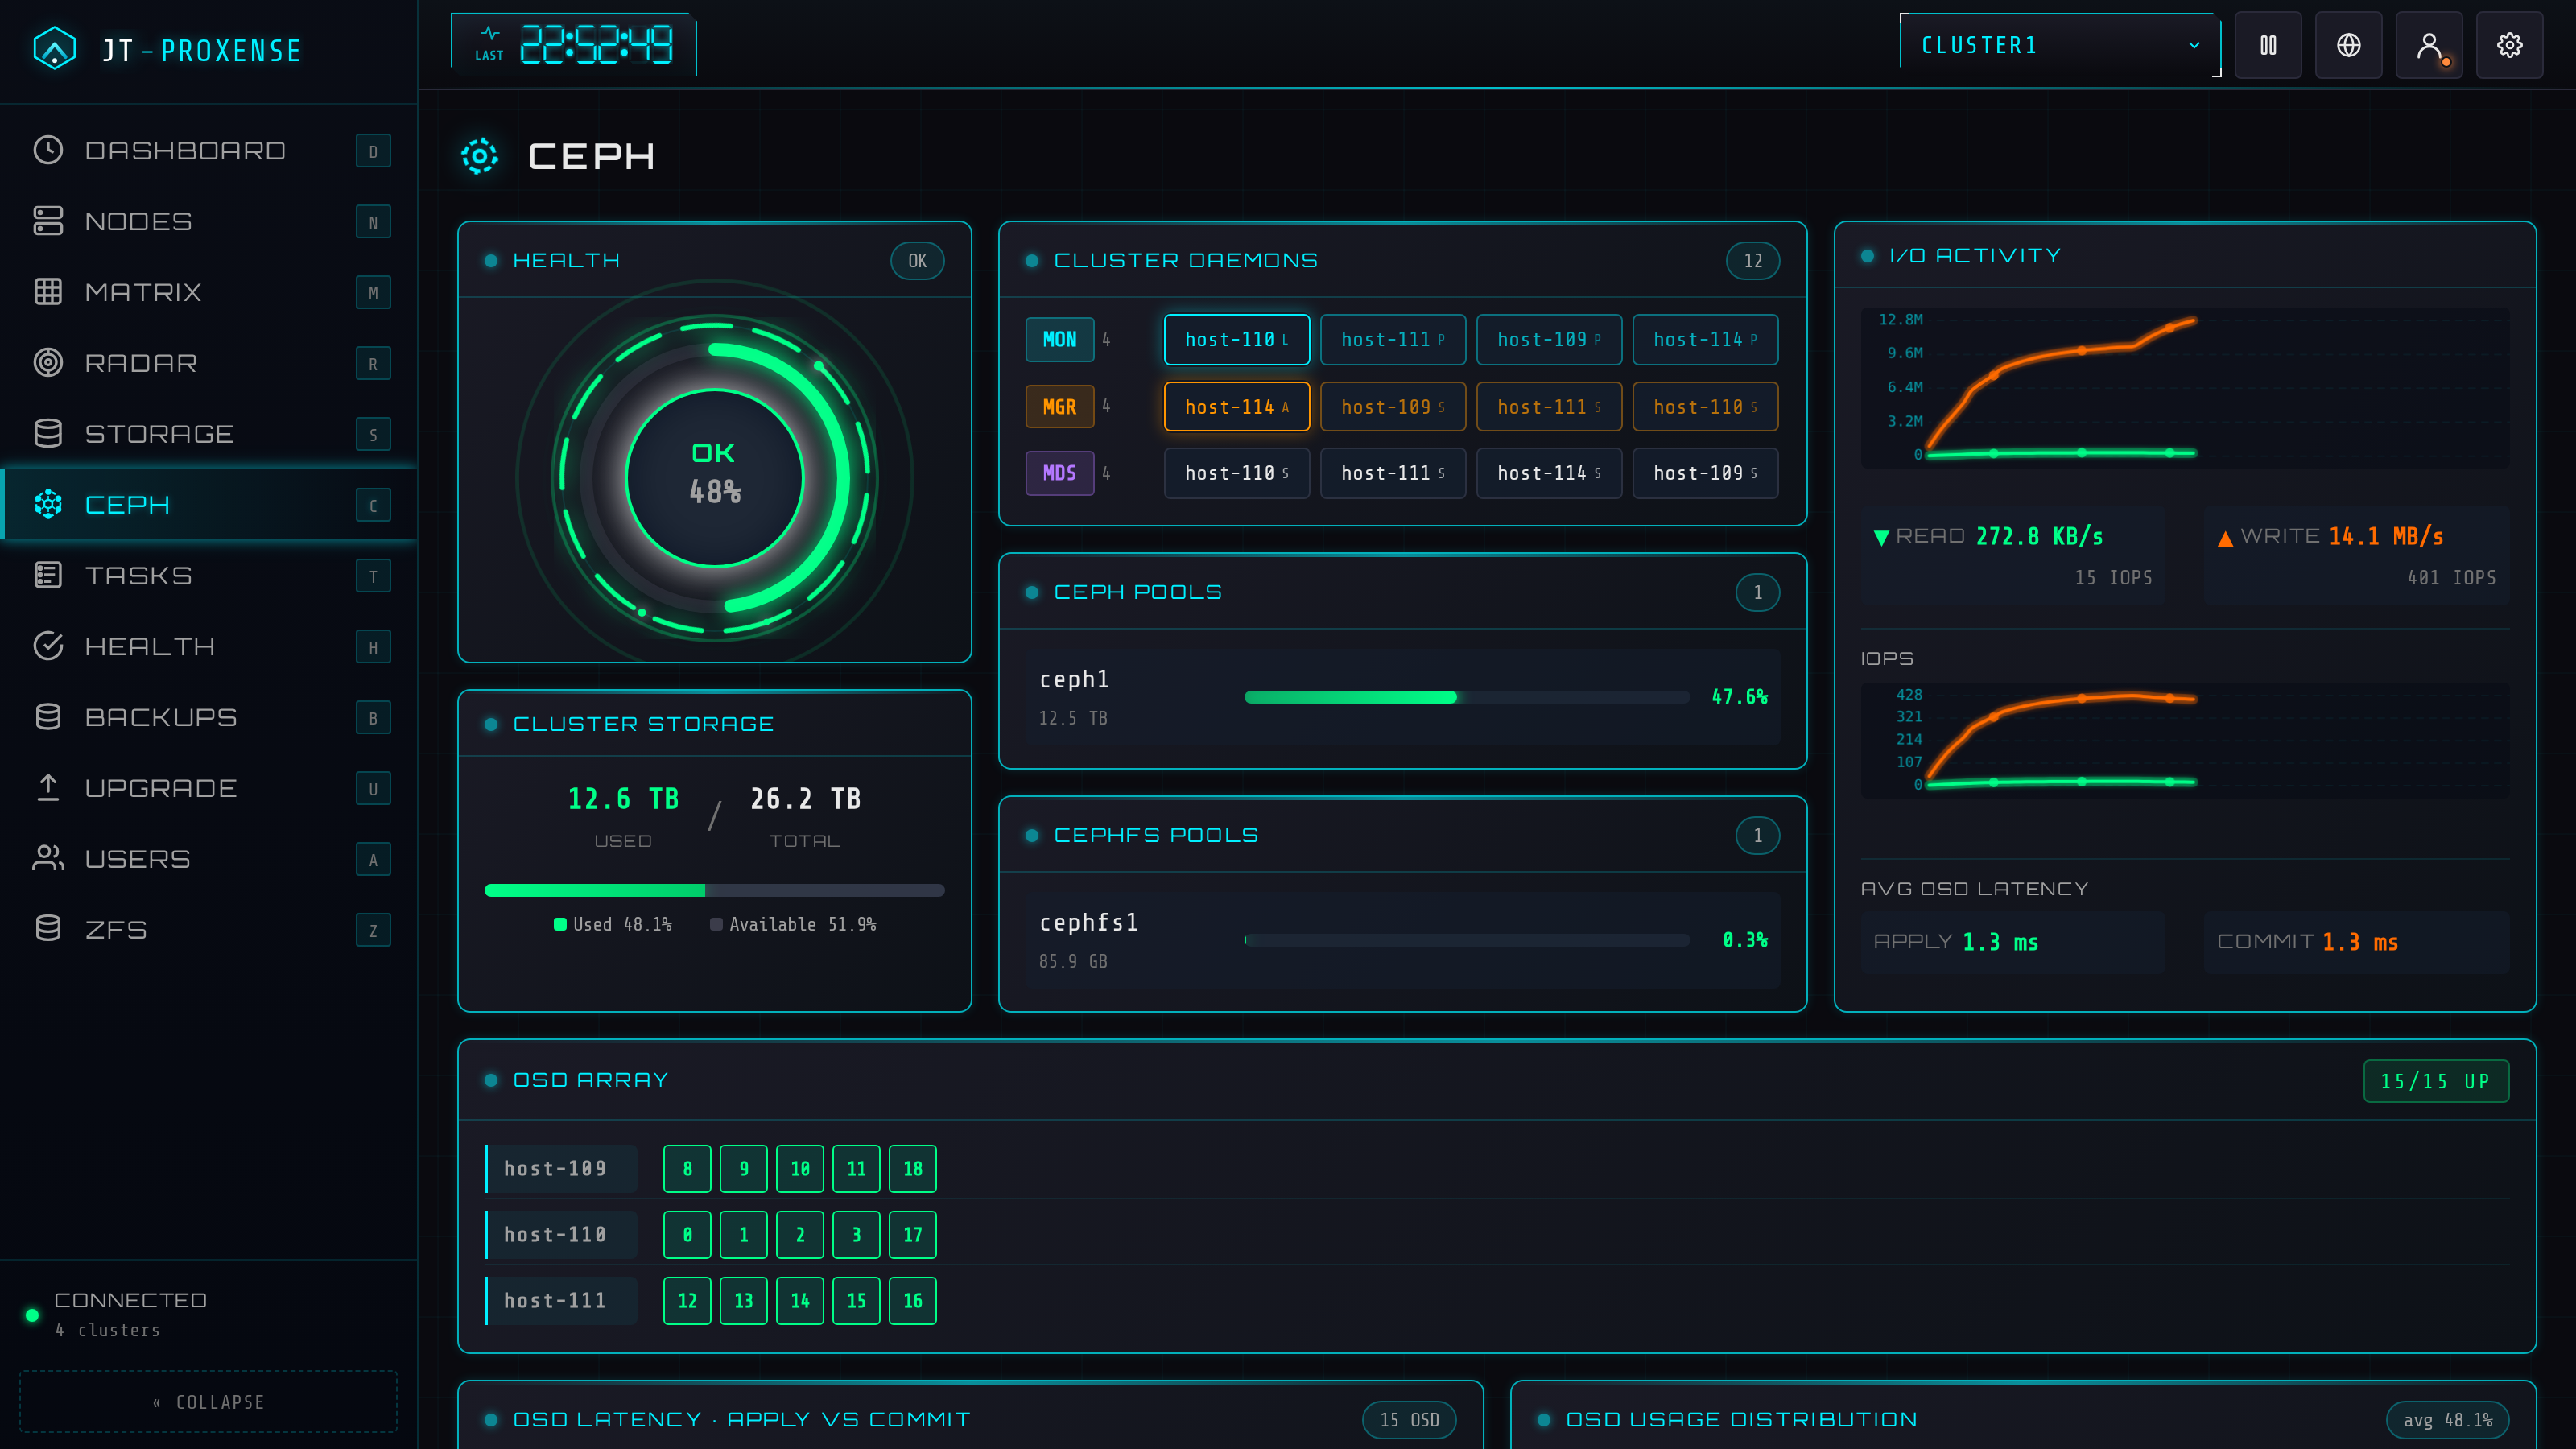
Ceph cluster topology with live IOPS. OSDs, pools, and recovery state on one canvas.
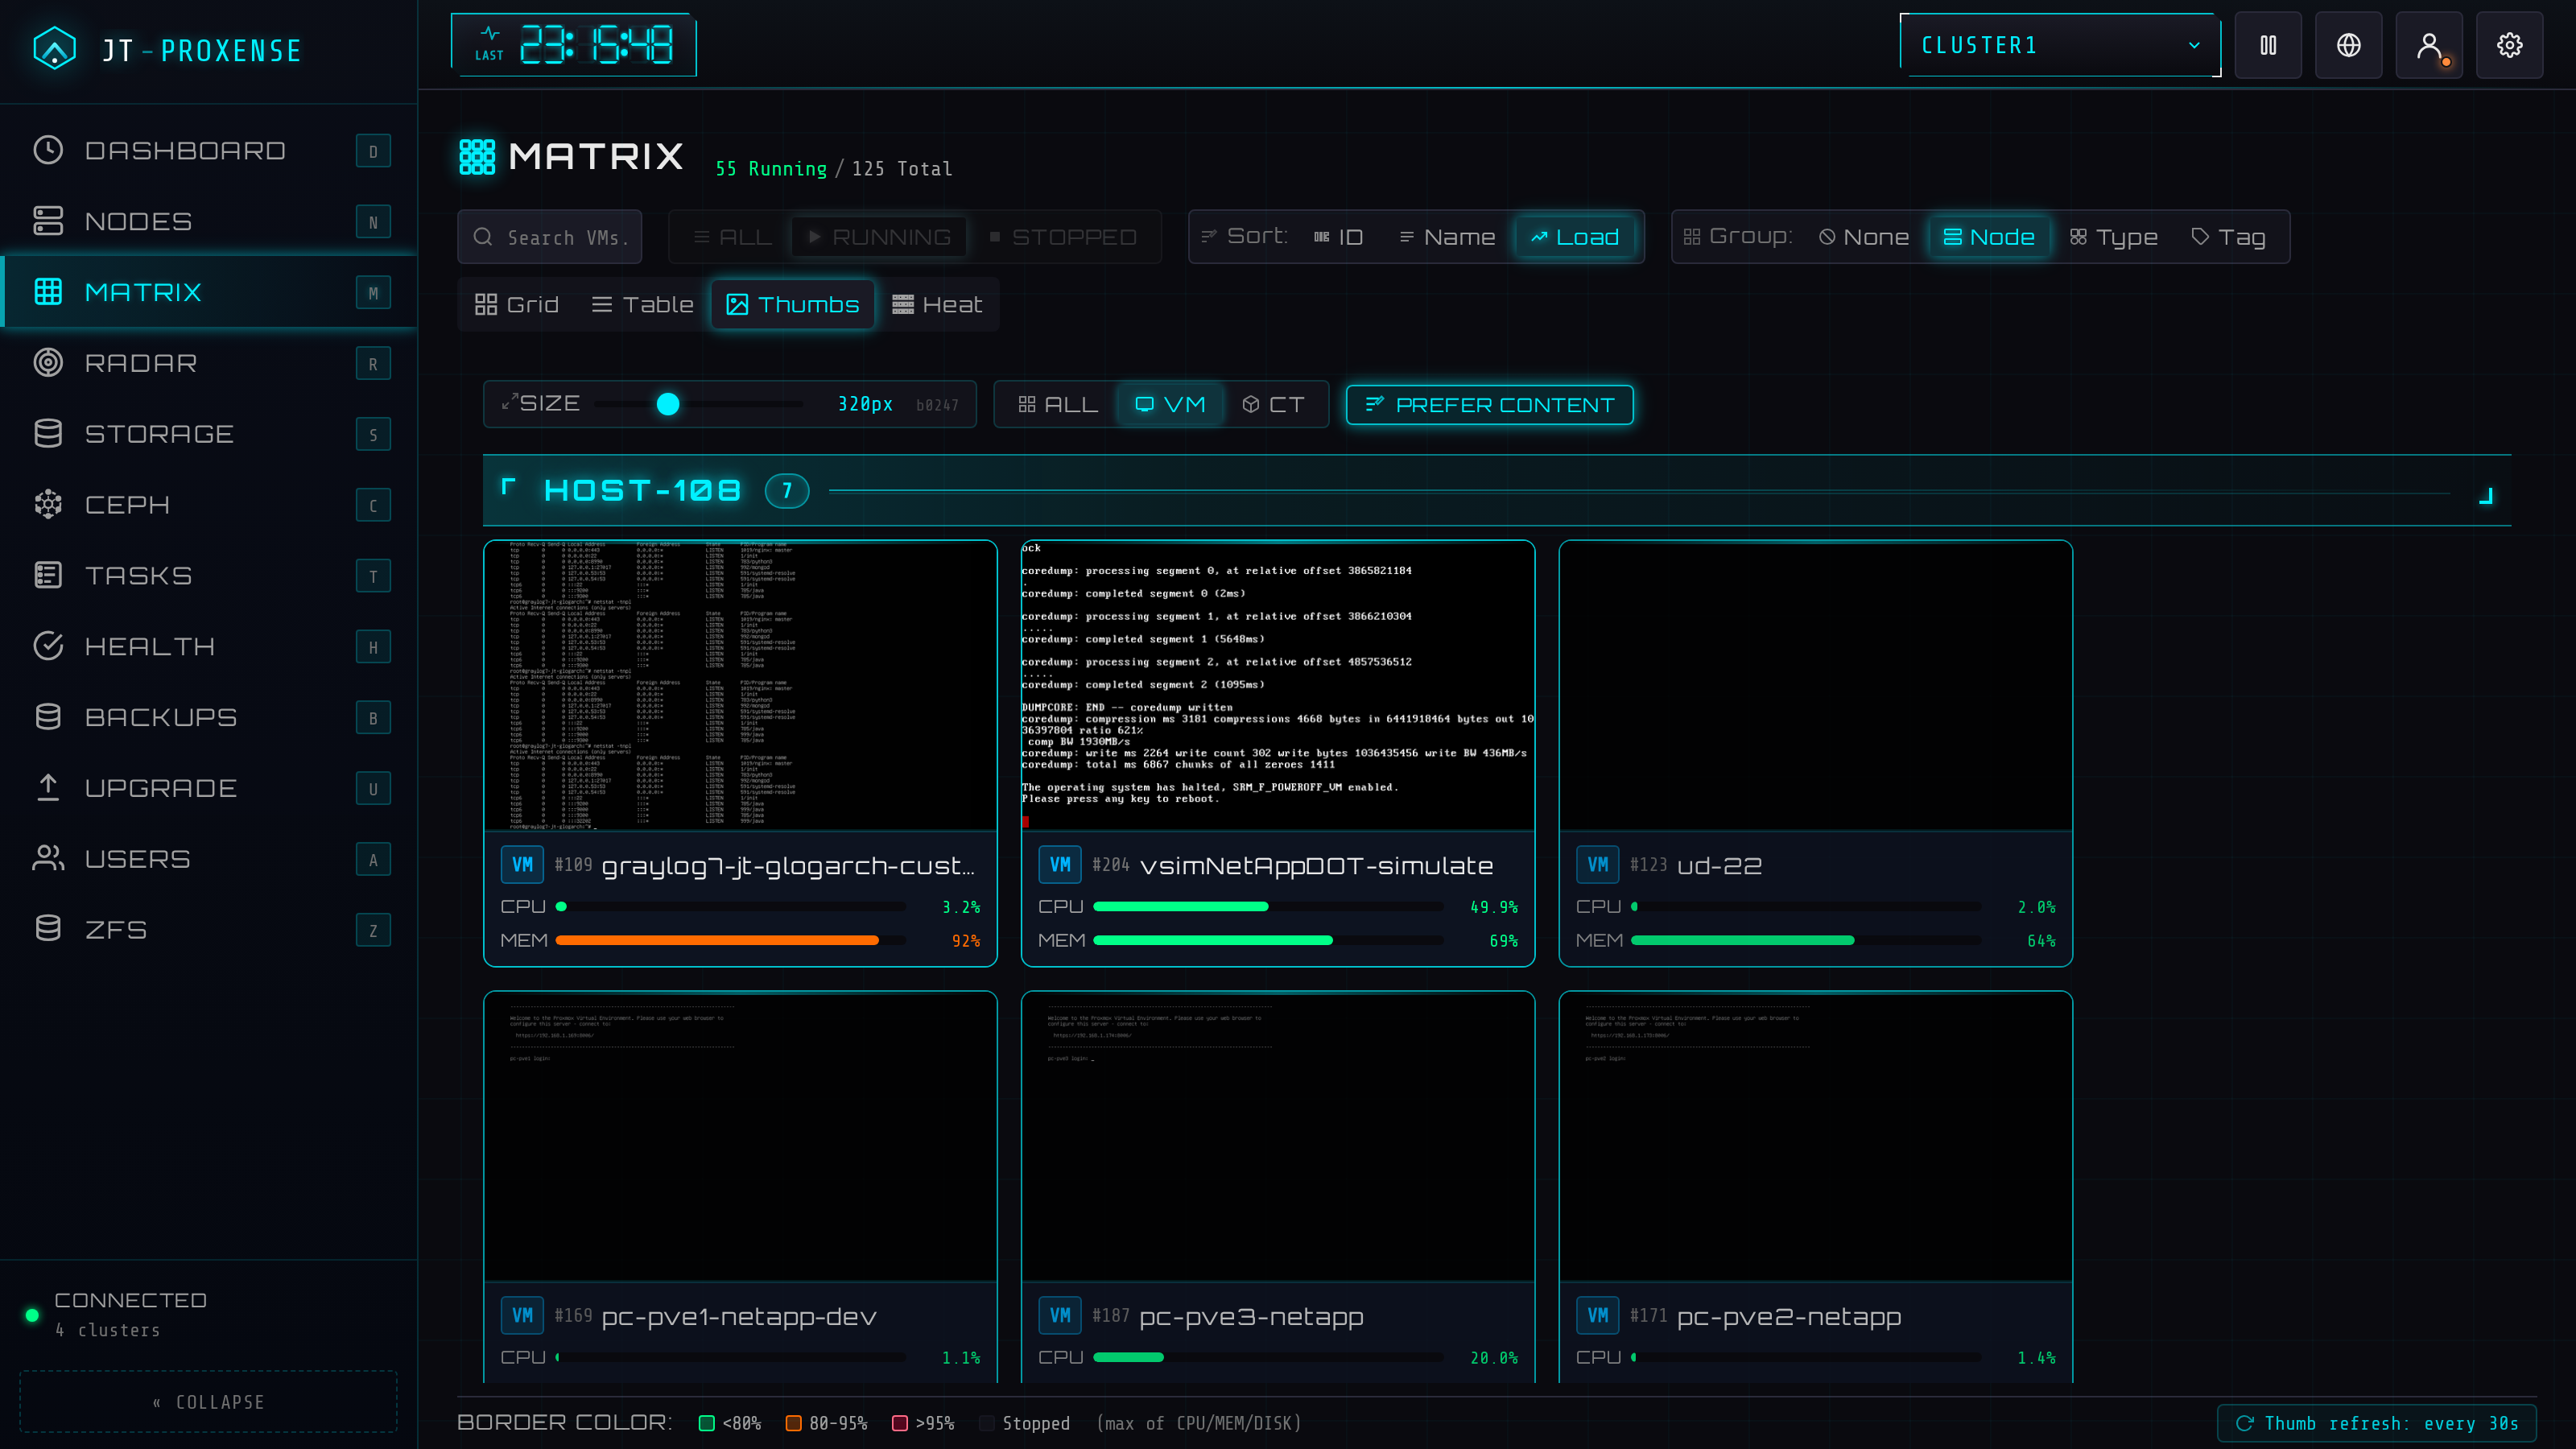
Live framebuffer screenshot for every running guest, group-able by node / type / tag. QEMU via a minimal RFB 3.8 client; LXC via termproxy + a vt100 emulator so CT cards show real shell output, not black boxes. Click any card for a full-size view with a CRT-static loading effect.
Wizard that introspects the source VM, picks an endpoint on the target cluster, fetches the TLS fingerprint, and lays out disk + NIC mappings. Validation, dry-run pre-checks, online / offline modes, and bandwidth limits. Admin-only; QEMU-only (PVE's API limit). Lock-recovery toast with copy-paste qm unlock hint when migration fails.
Click any file-level storage → tabs by content type (Backups / ISO / CT templates / Snippets / Import / Disk images / CT root) — only the tabs the storage actually carries. Sortable list, search, delete with audit. Block-level storages (RBD / LVM / ZFSpool) get a list-only view.
InfluxDB v2 endpoint at /api/v2/write (token-auth, gzip-tolerant). Per-host ring buffer of the most recent samples, exposed via /api/telegraf/{hosts,host}. Bring your own Telegraf outputs.influxdb_v2 on each PVE host, get supplemental metrics surfaced alongside the API-polled ones.
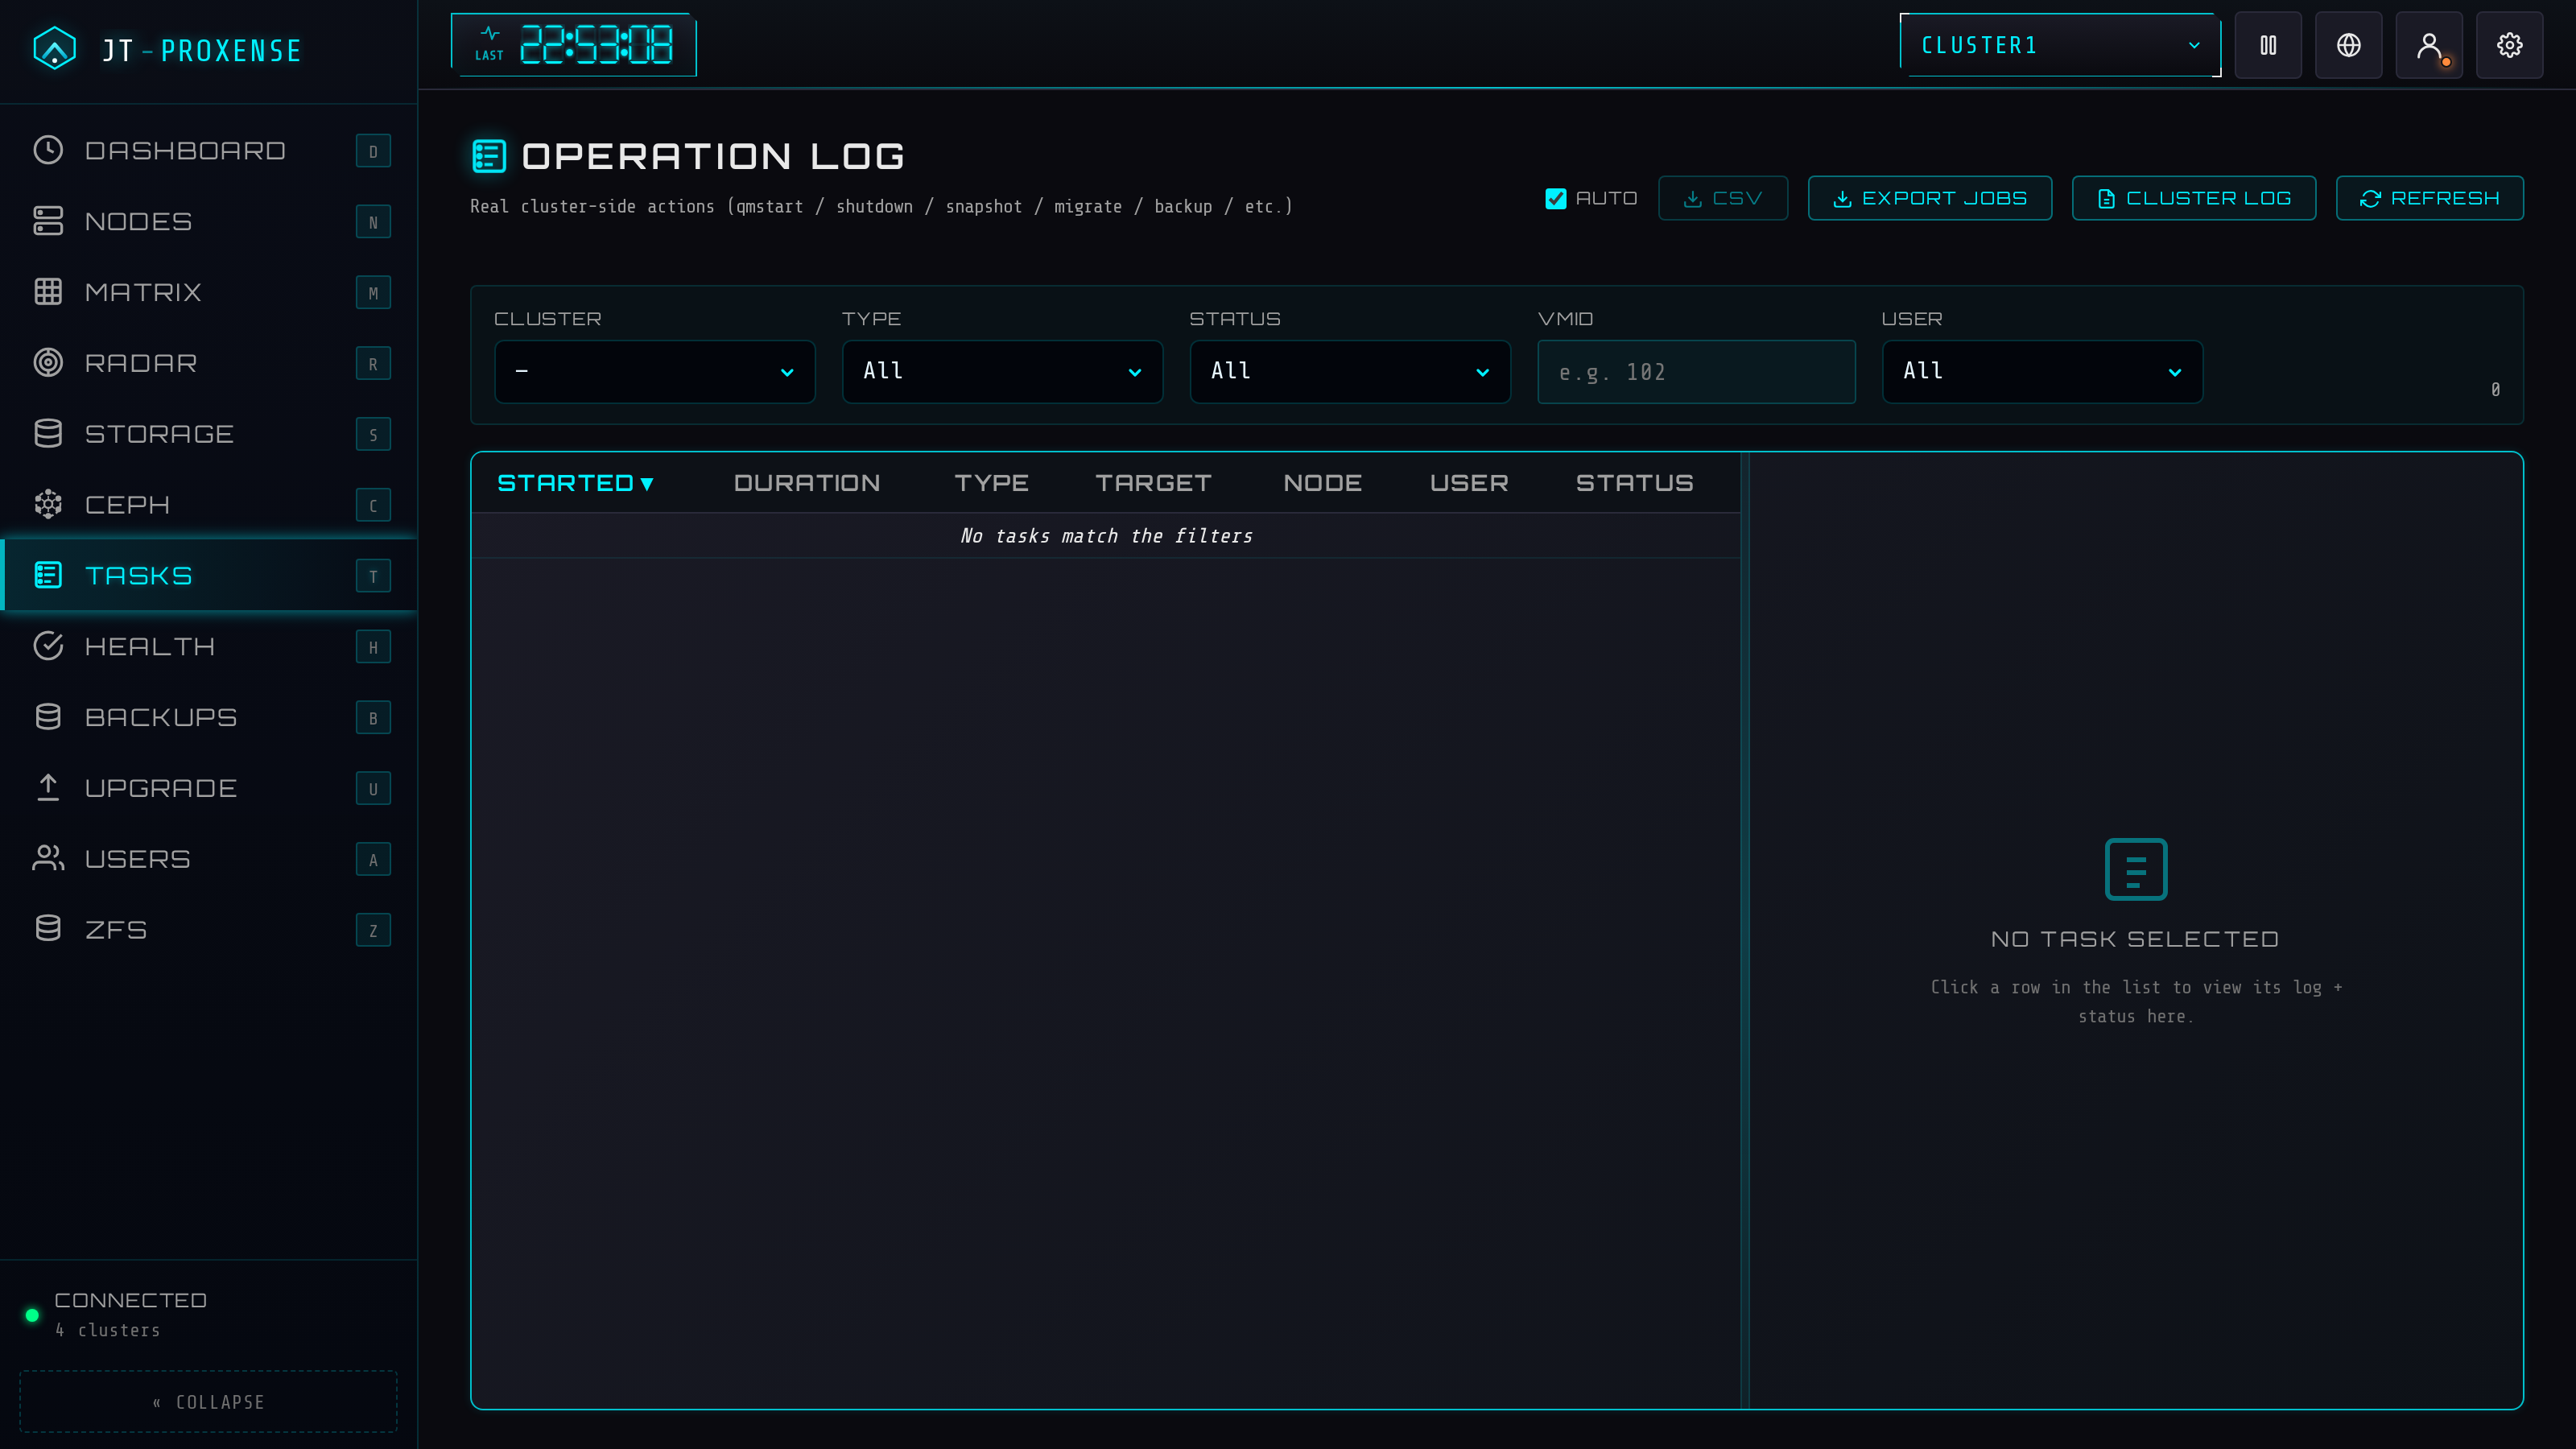
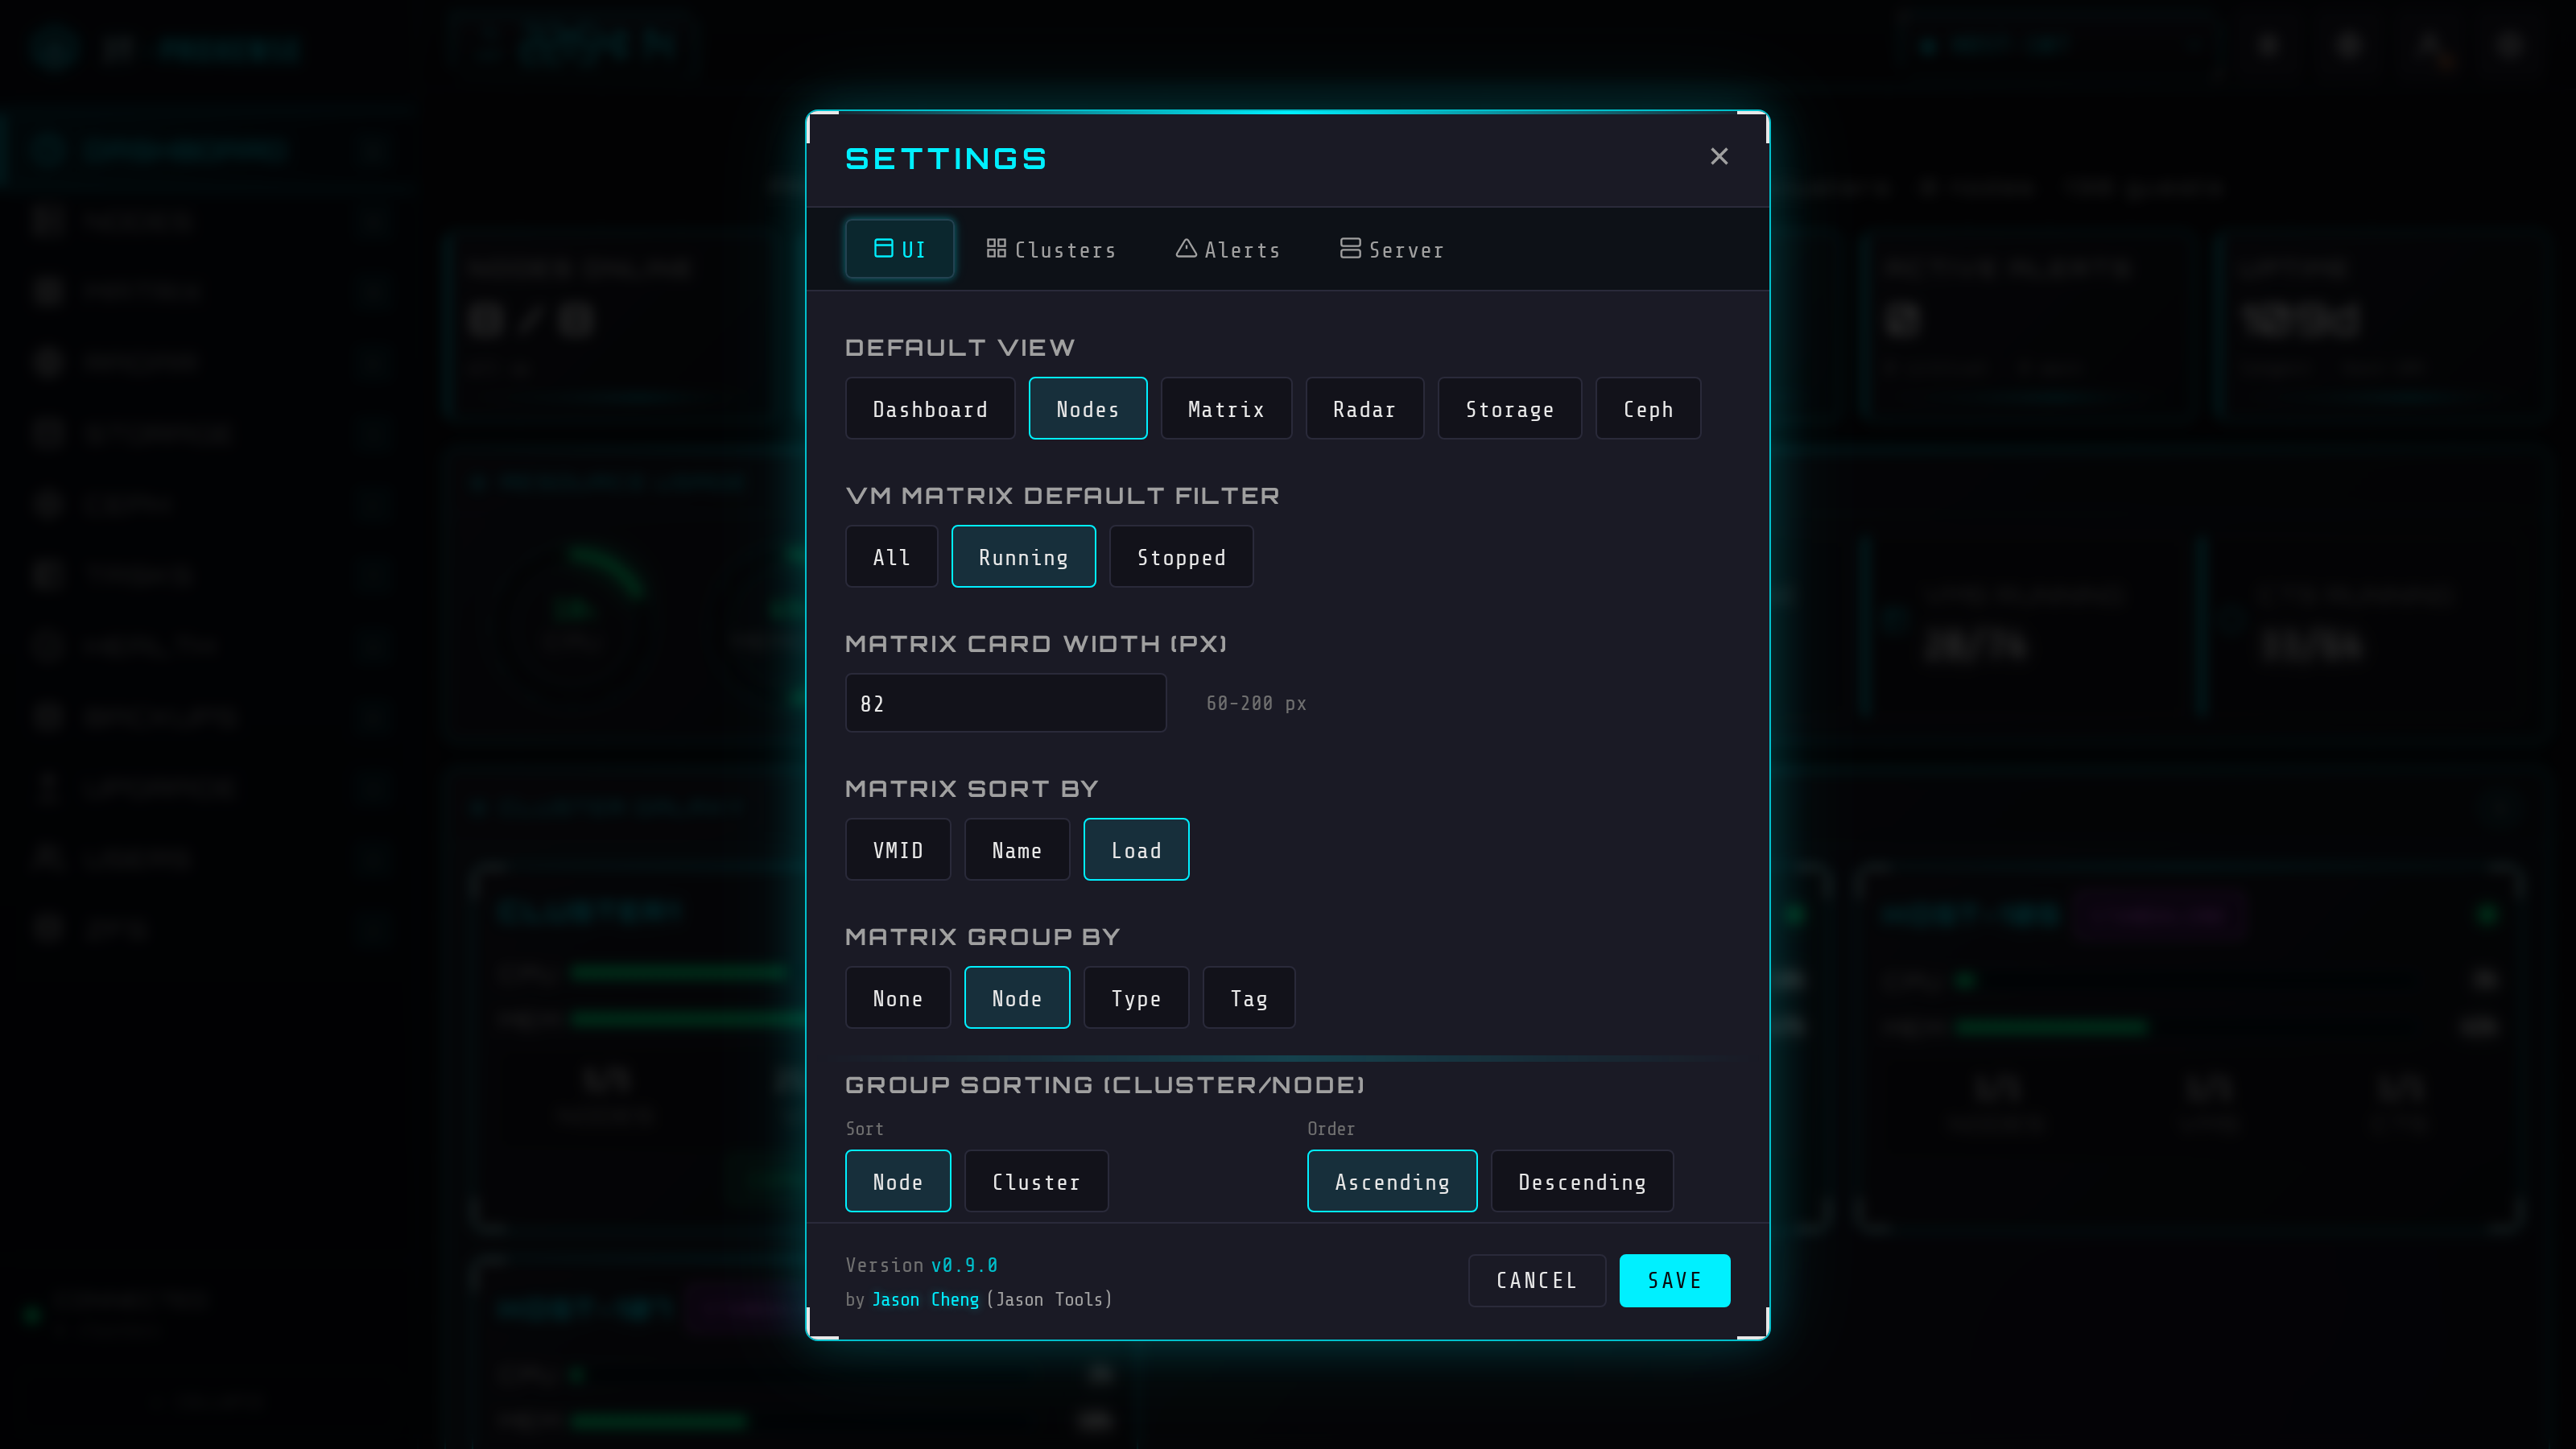
Opt-in authentication, audit log, role-based access, VM & LXC lifecycle, all under the same cyberpunk skin. Default behavior unchanged from v0.1 — flip a flag to enable each layer.
Argon2id passwords + 12 h sessions, optional PAM backend (system accounts), TOTP 2FA with 8 backup codes. Per-IP brute-force rate limit.
Append-only SQLite audit trail. Every login, role change, config edit, VM action recorded. CSV export, date filter, expandable detail rows.
Three roles (viewer / operator / admin), scoped per-cluster AND per-VM. Match by name (web-*) or tag (tag:prod). Highest-rank match wins.
start / stop / shutdown / reboot / suspend / migrate. Bulk operations across mixed VM and CT vmids in one request. Disabled by default — explicit opt-in.
If you ever lock yourself out: jt-proxense auth disable works without the service running. Reset passwords, clear lost authenticators, fix bad config — all offline. Hit "too many attempts"? jt-proxense unlock clears the per-IP login rate limit (it never touches passwords).
pytest covers migrations, auth, audit triggers, role gating, VM + CT dispatch, RBAC, host-upgrade state machine, mocked PVE. Runs in CI on every push.
Proactive health, scheduled backups, rolling upgrades, exports and accounts — the day-to-day of running a fleet, not just watching one.
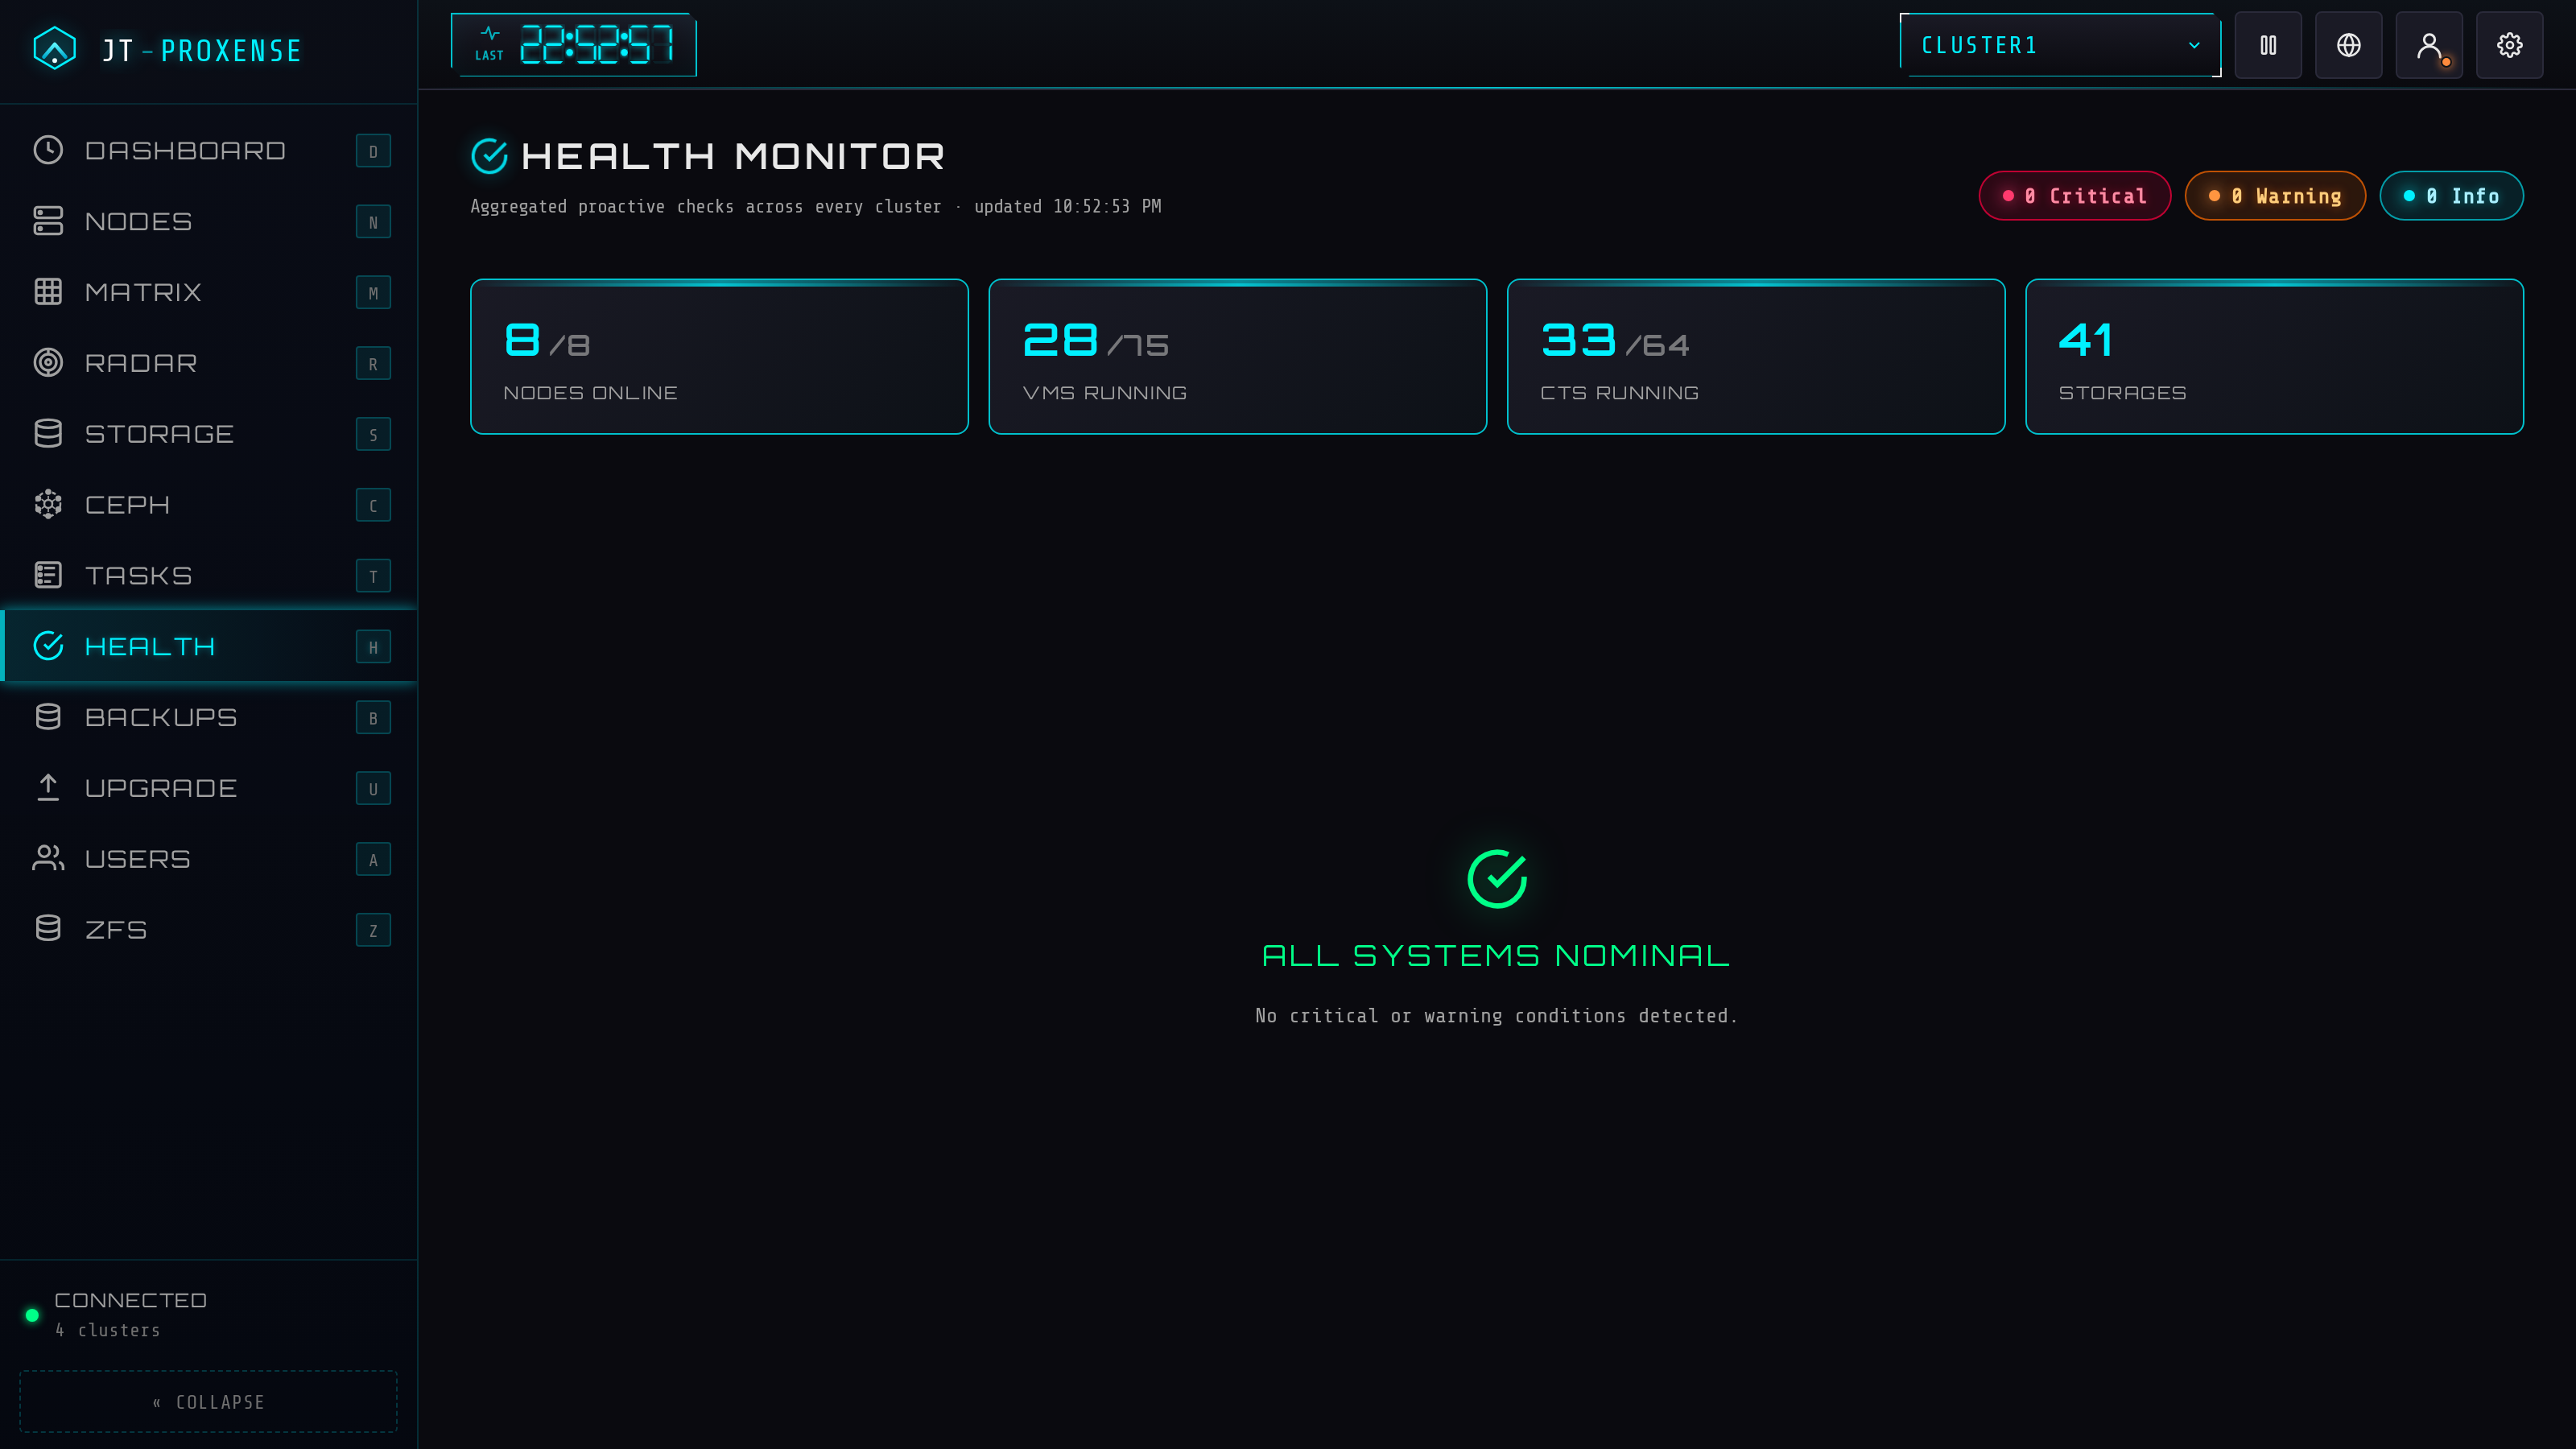
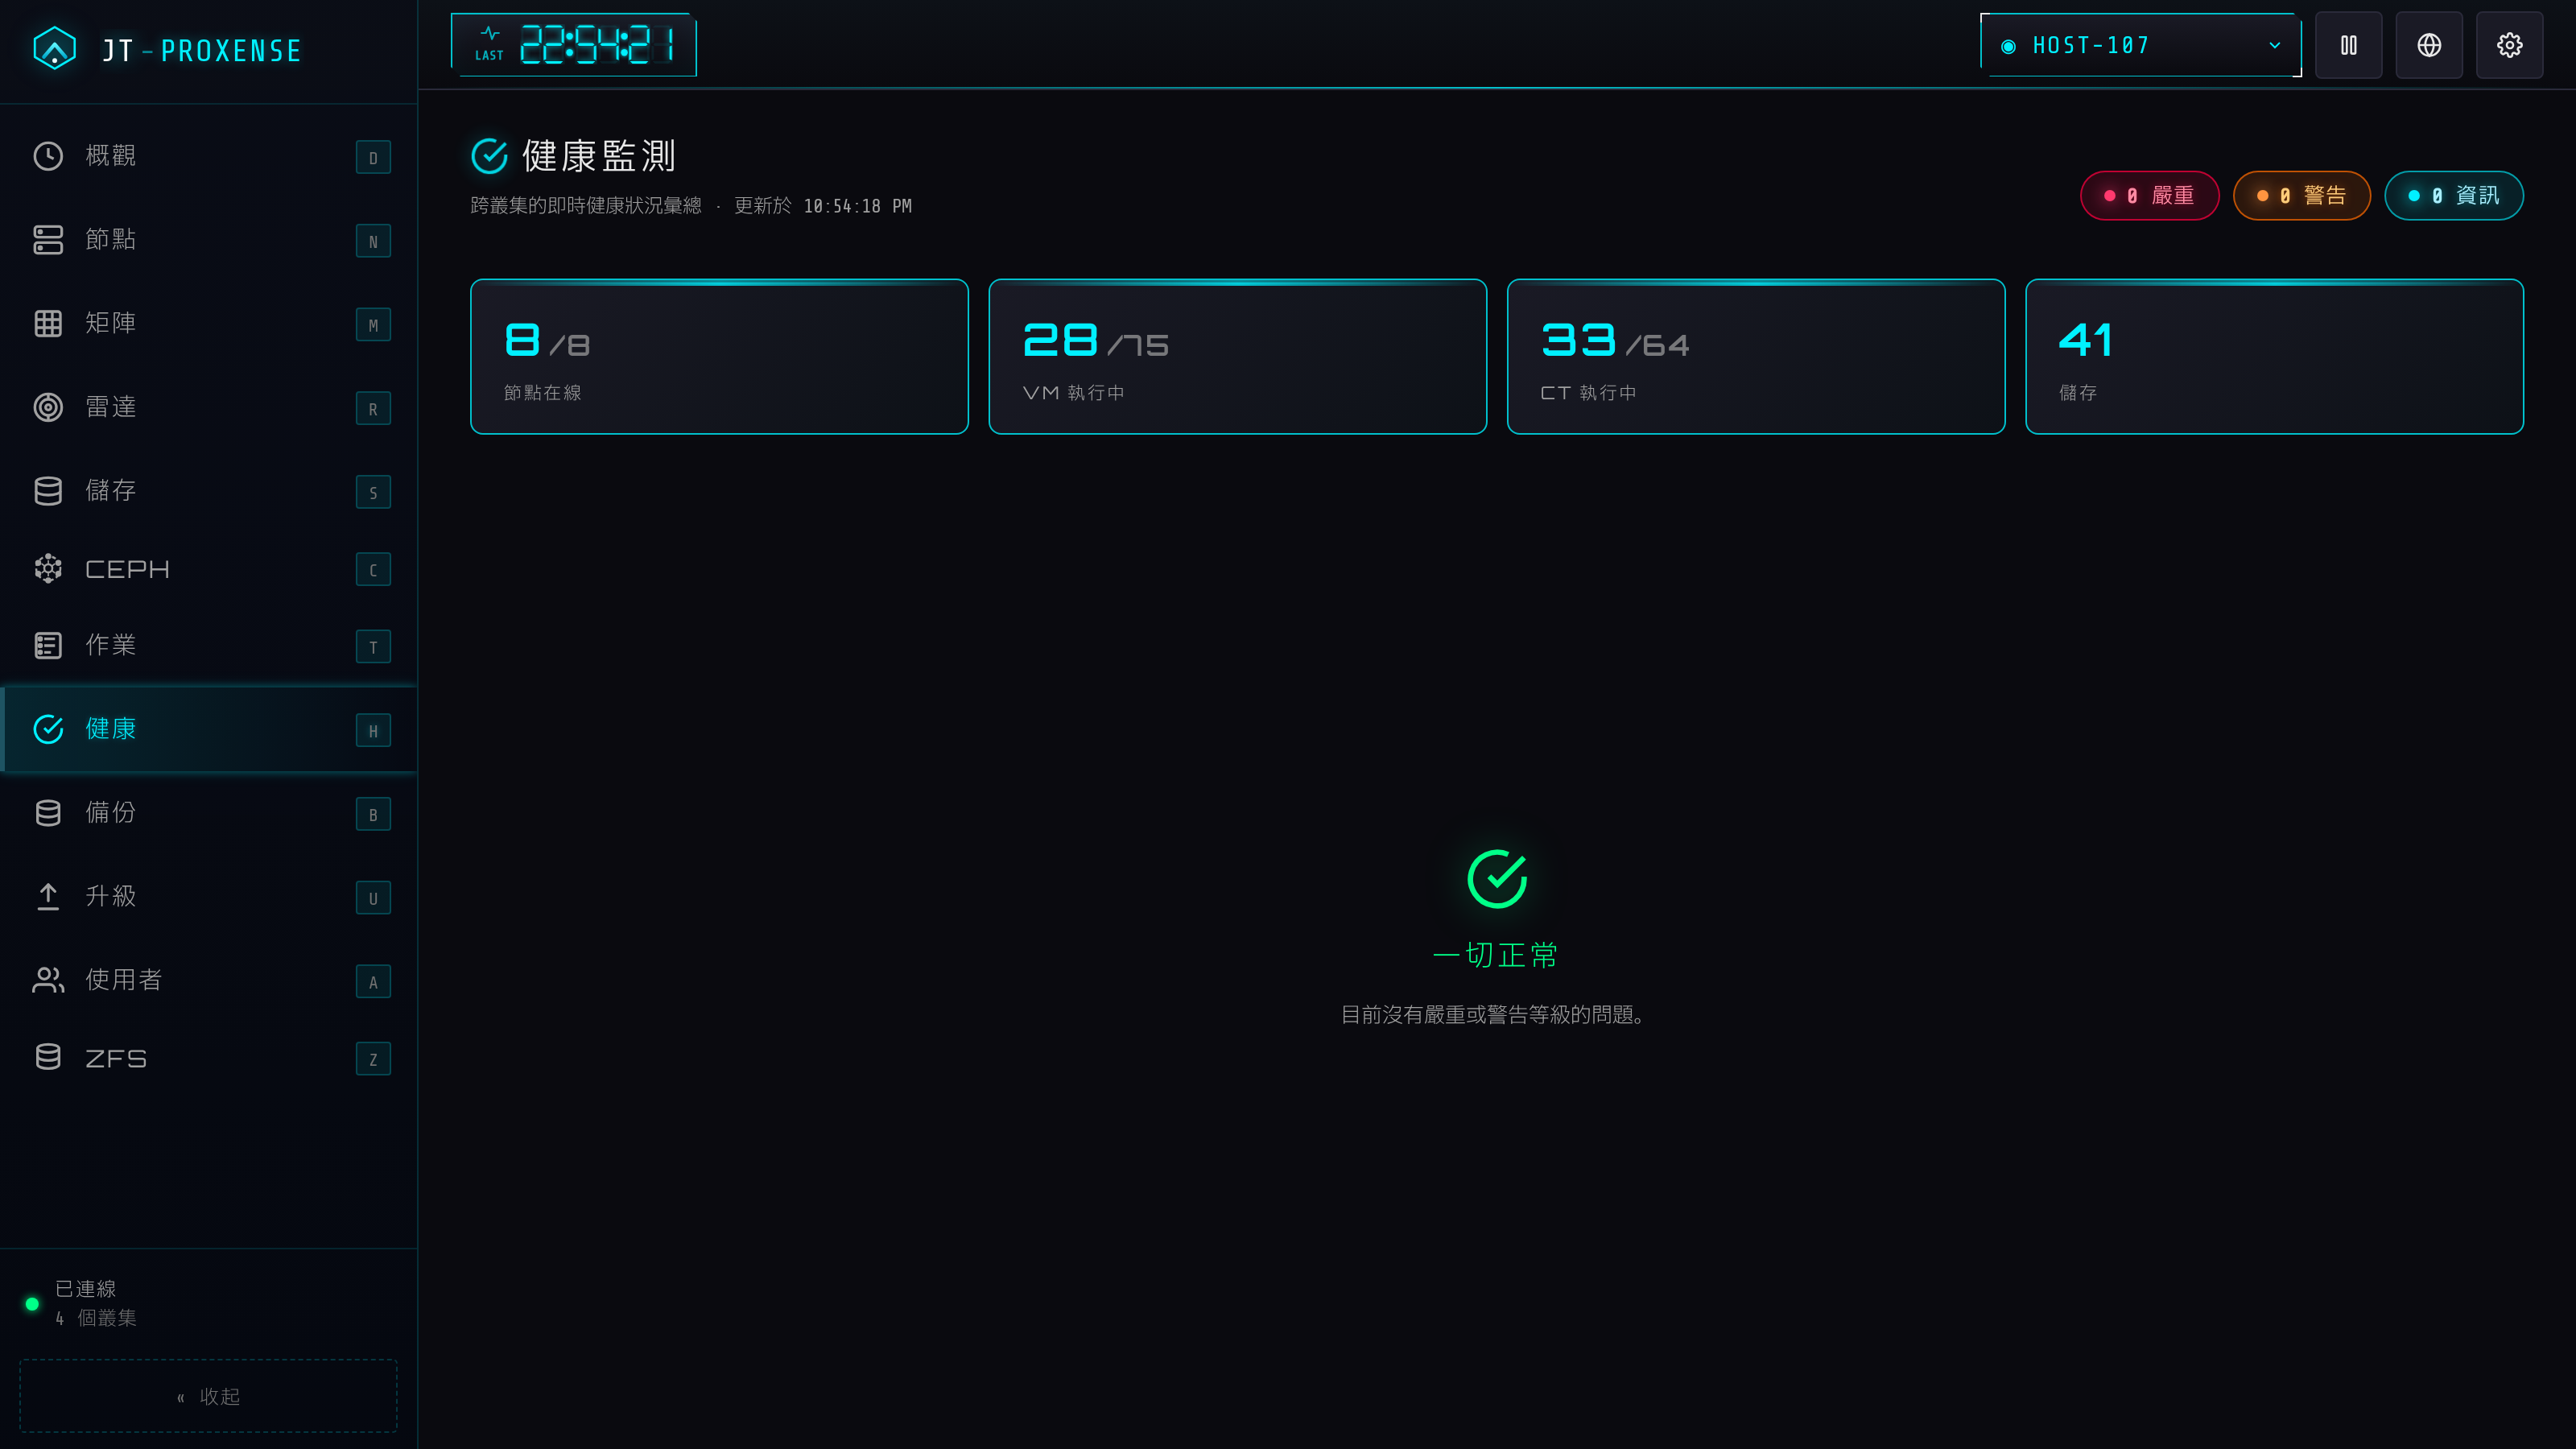
One page aggregates every proactive check across all clusters: node down, high CPU / mem, storage nearly full, Ceph warnings, cert expiry, pending updates, HA + replication state — plus log-derived hardware findings (ECC / MCE / OOM / disk I/O / fs corruption scanned from each node's syslog). A dedicated Corosync panel shows quorum, votes, per-node link status and ring latency.
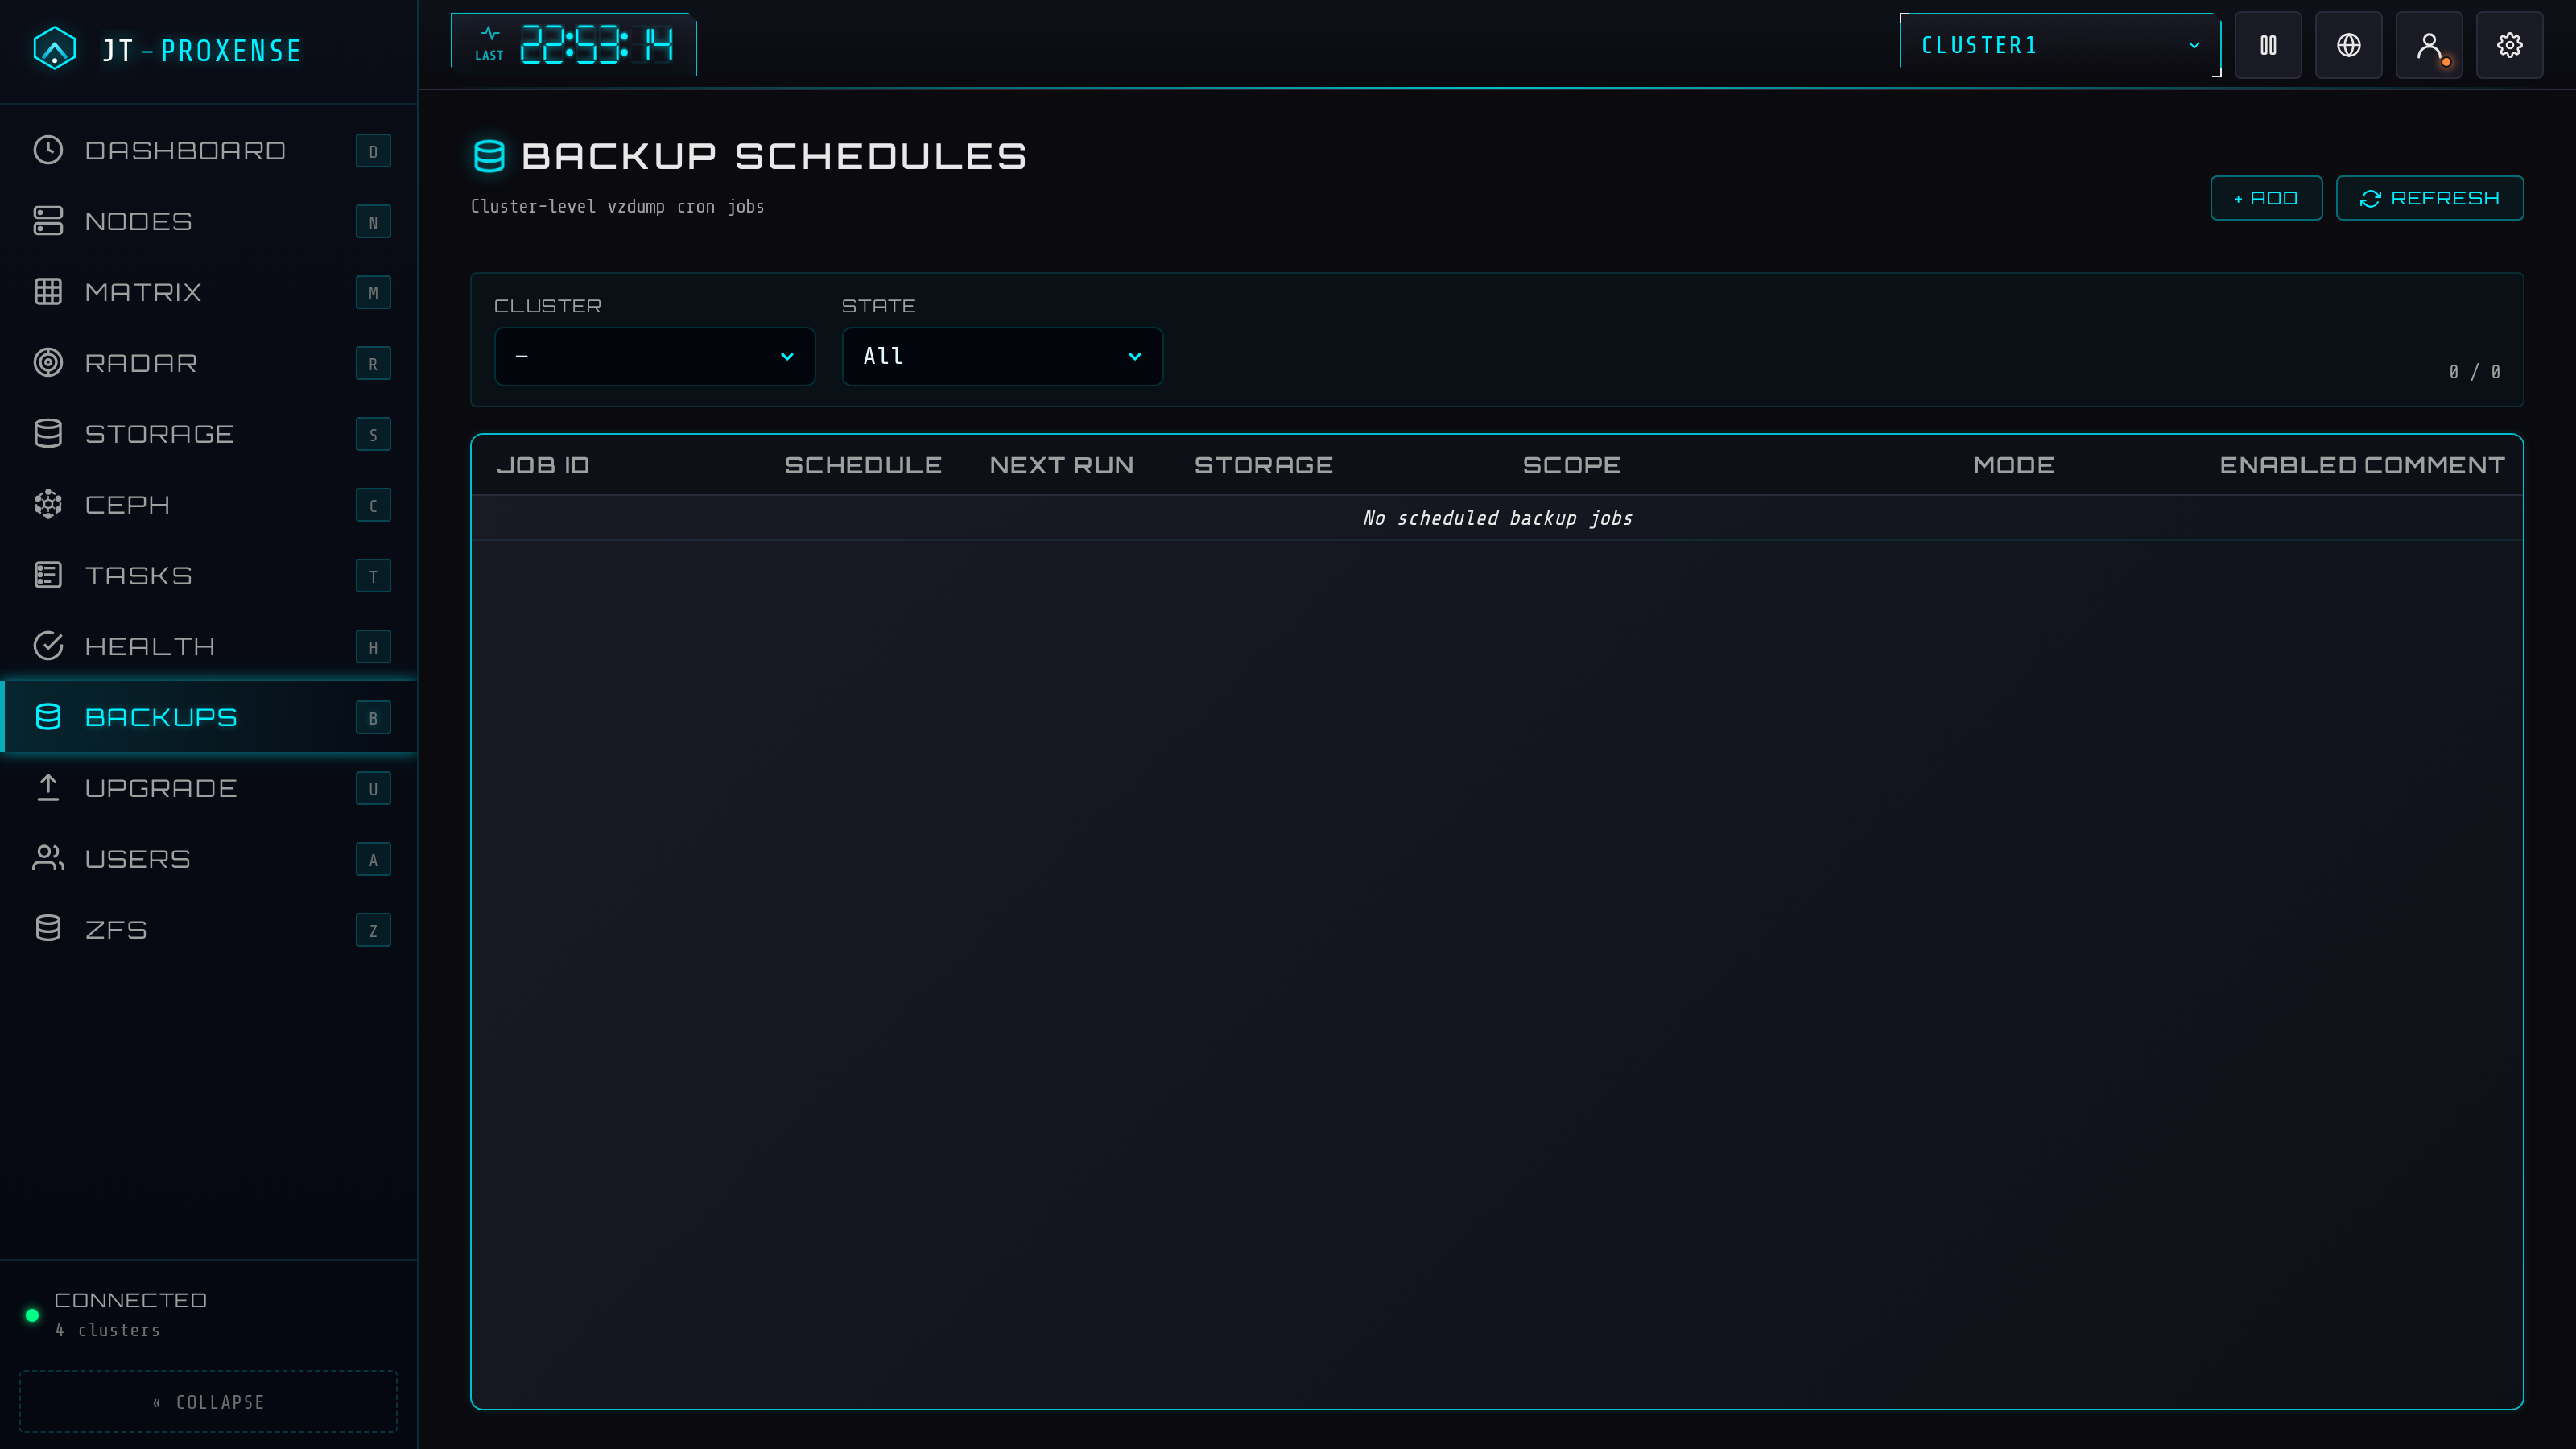
Read and manage cluster-level vzdump cron jobs, plus fire an ad-hoc backup from a modal. When the target is a Proxmox Backup Server the compression box disappears (PBS dedups) and PBS extras surface: notes-template, protected, mail-on-failure. Per-VM backup history with restore + verify.
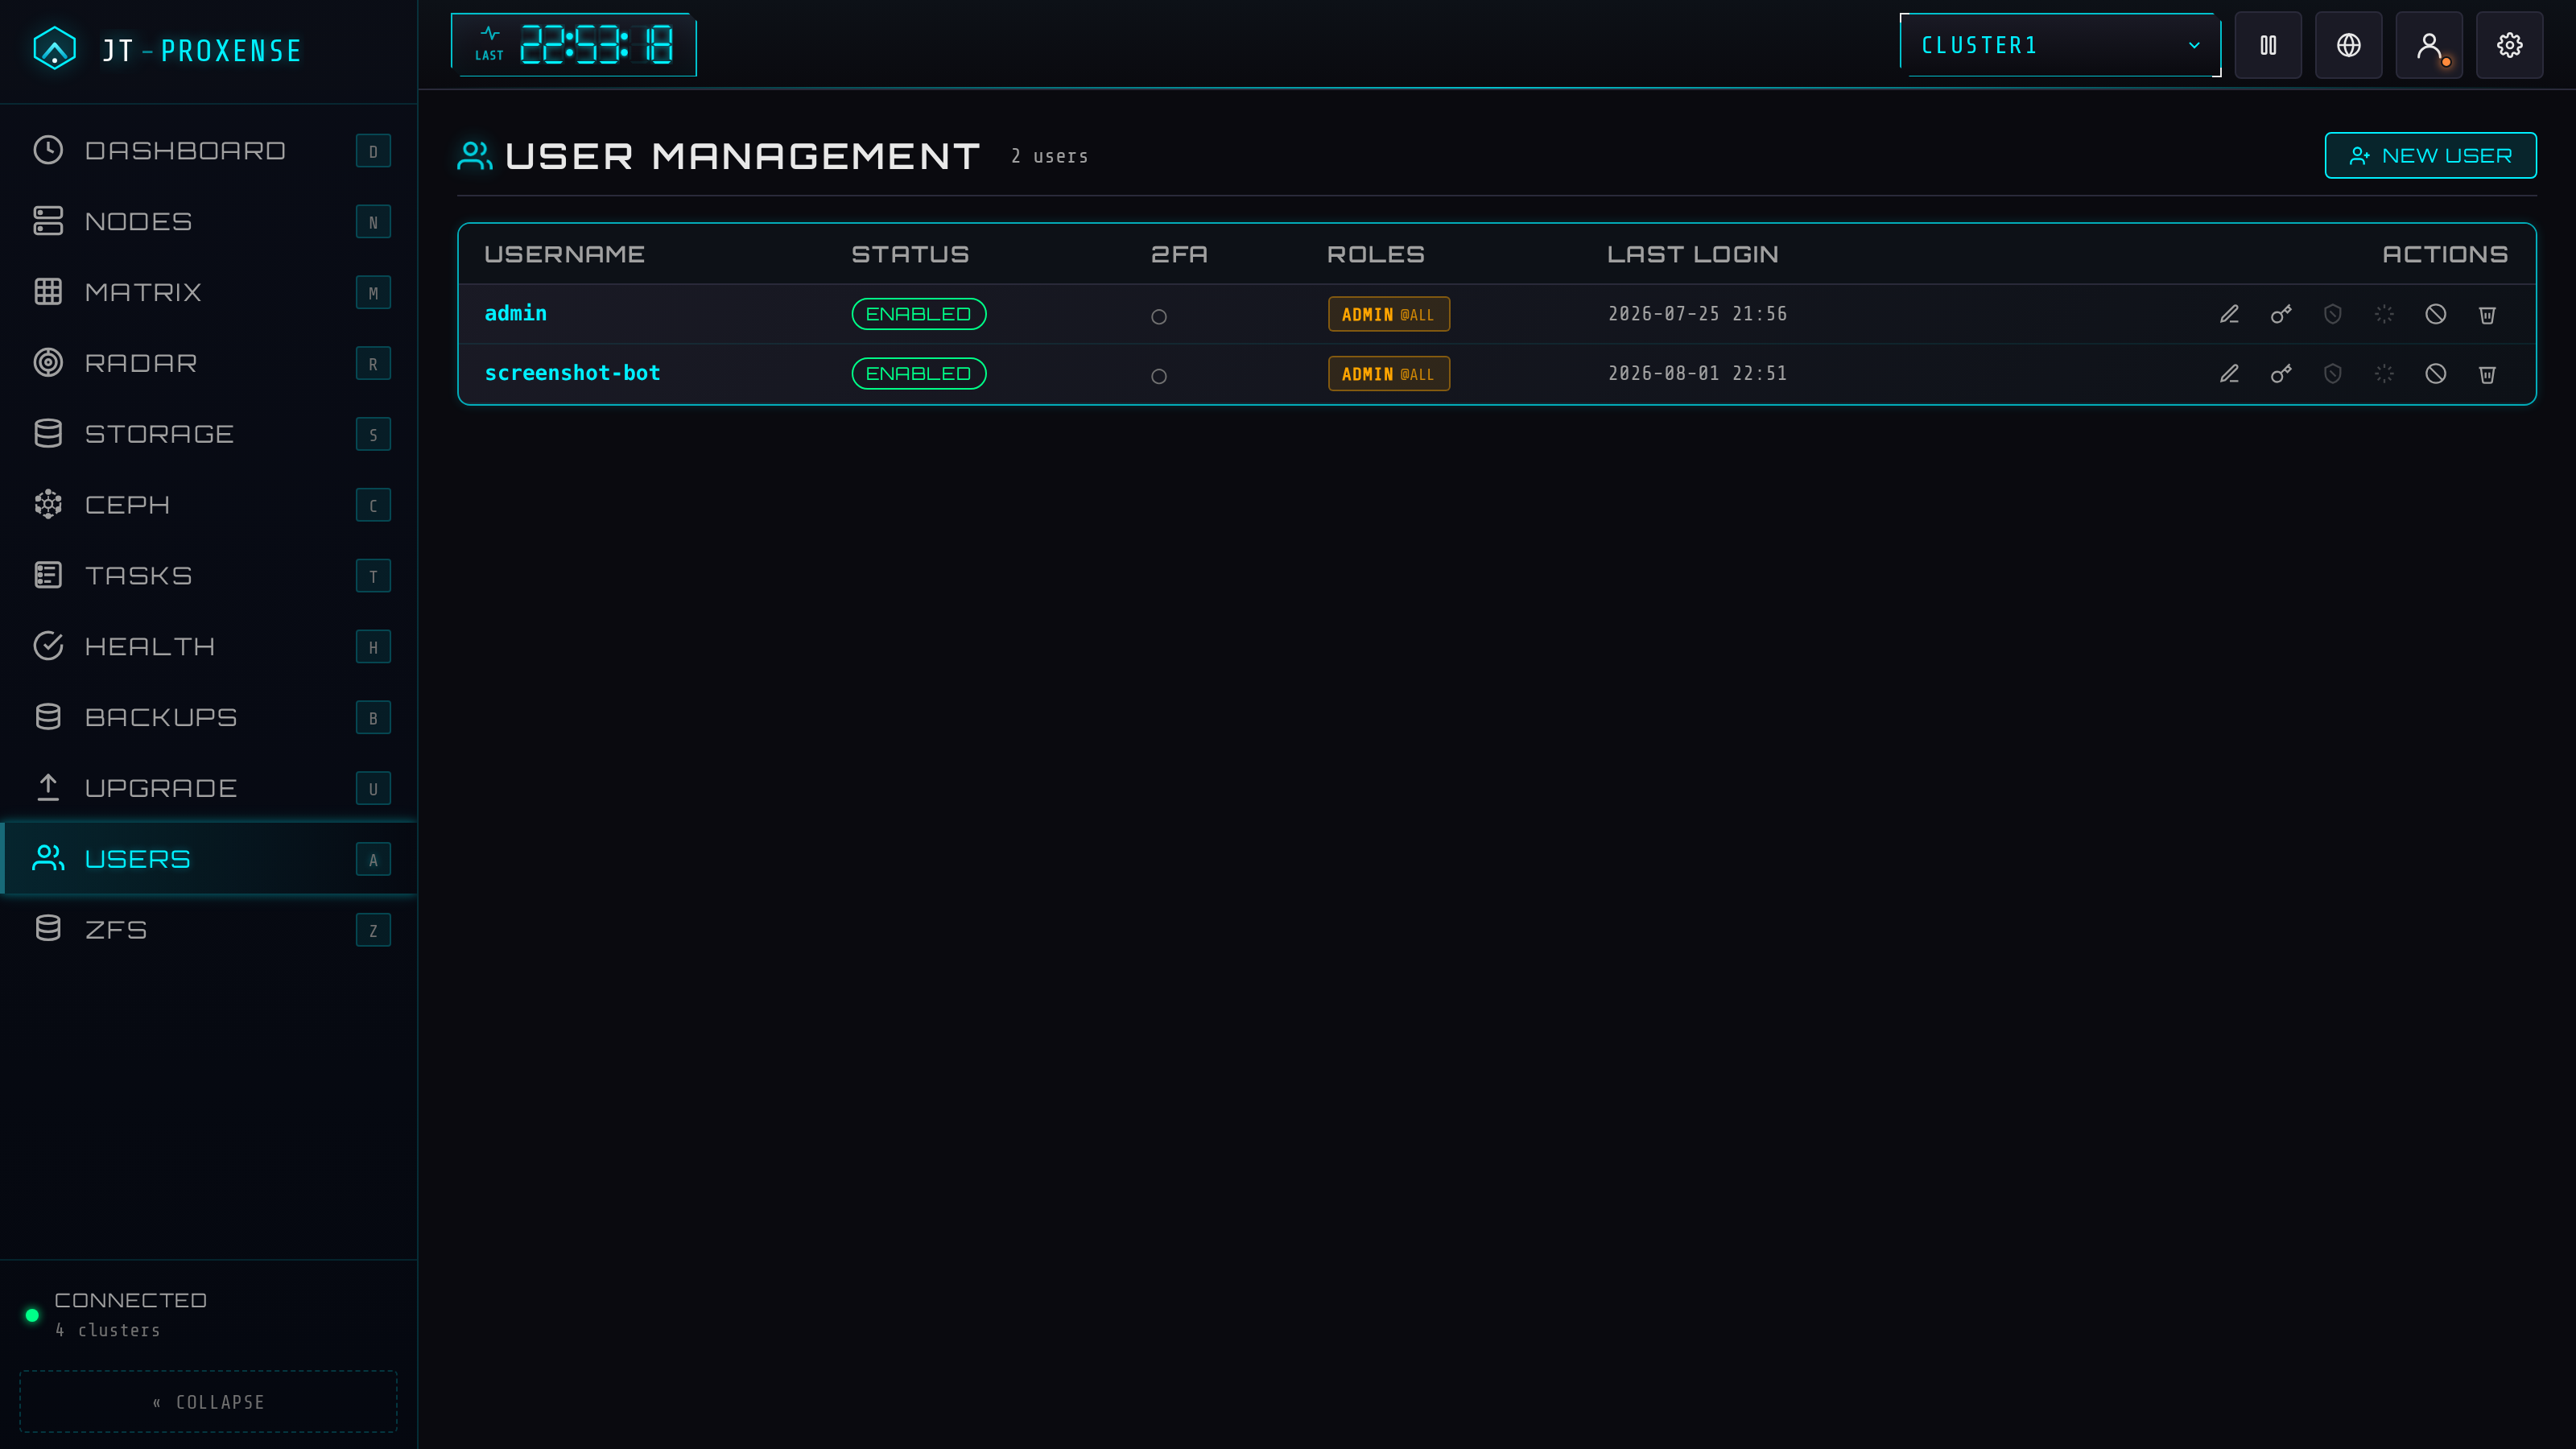
Full RBAC from the WebUI: create local users, grant roles per cluster and per VM-pattern, enrol / reset TOTP, re-issue backup codes, disable / delete. Local, PAM and LDAP backends; every mutating action lands in the append-only audit log.
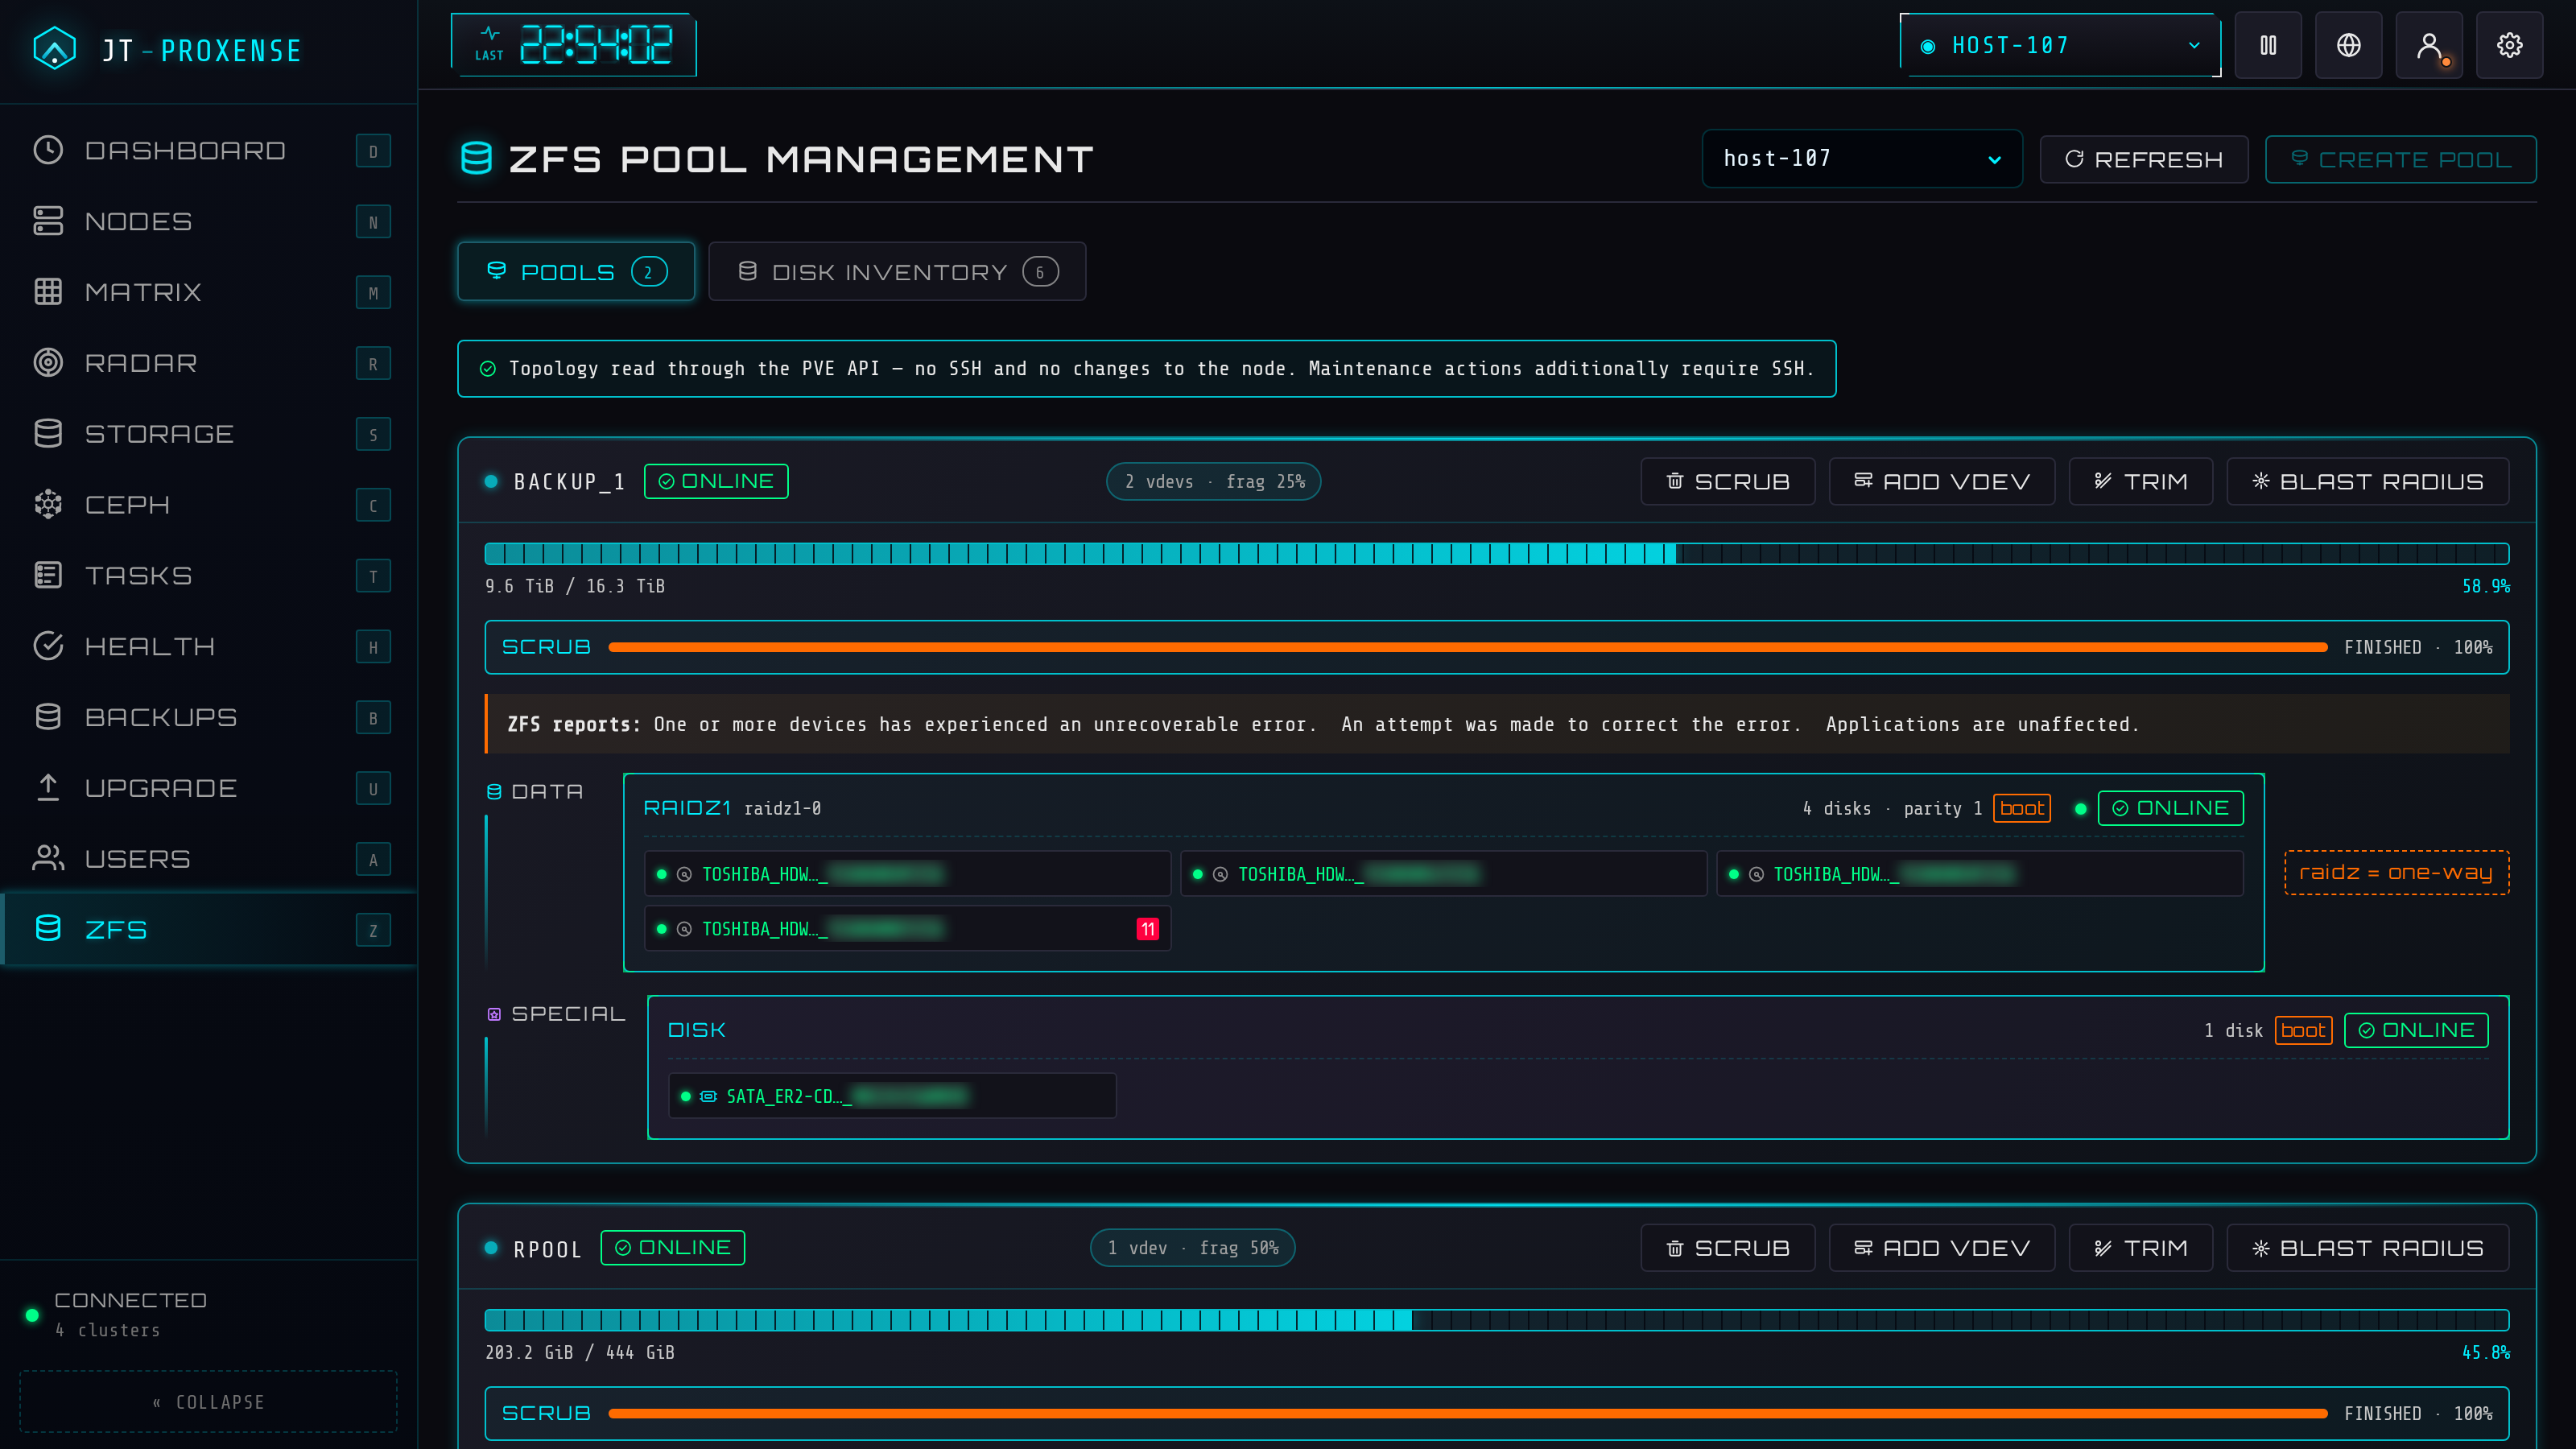
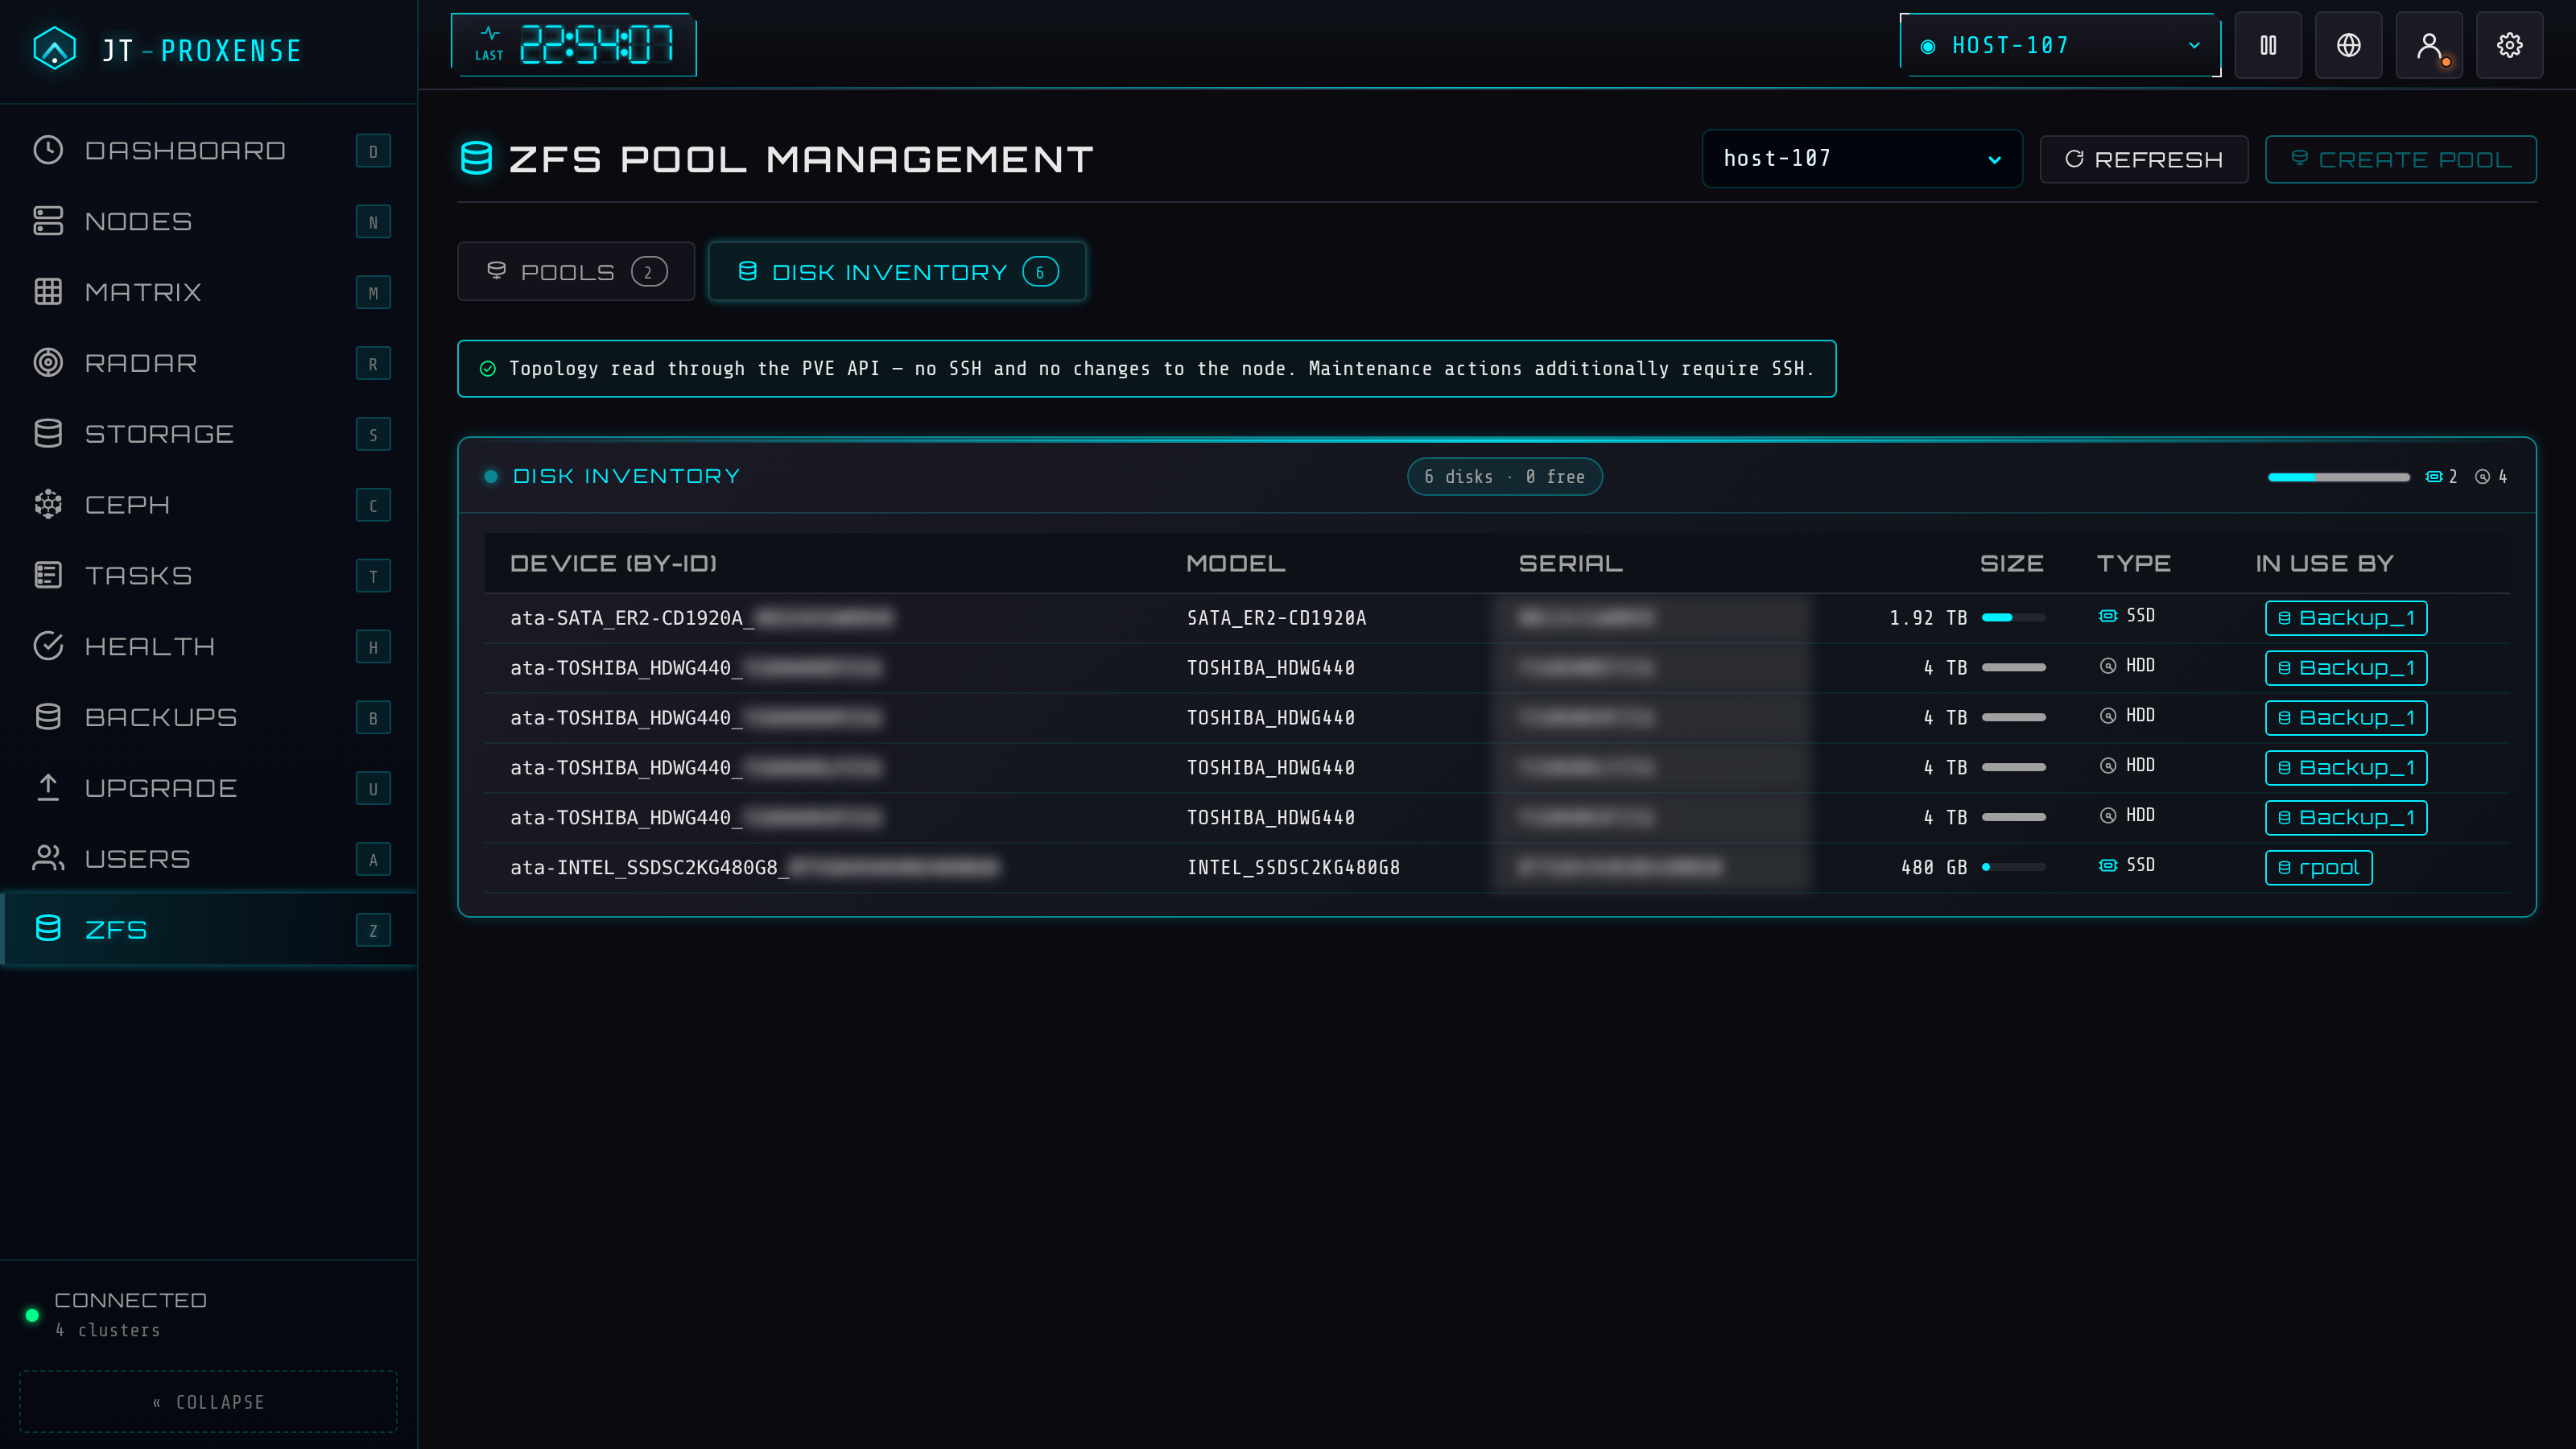
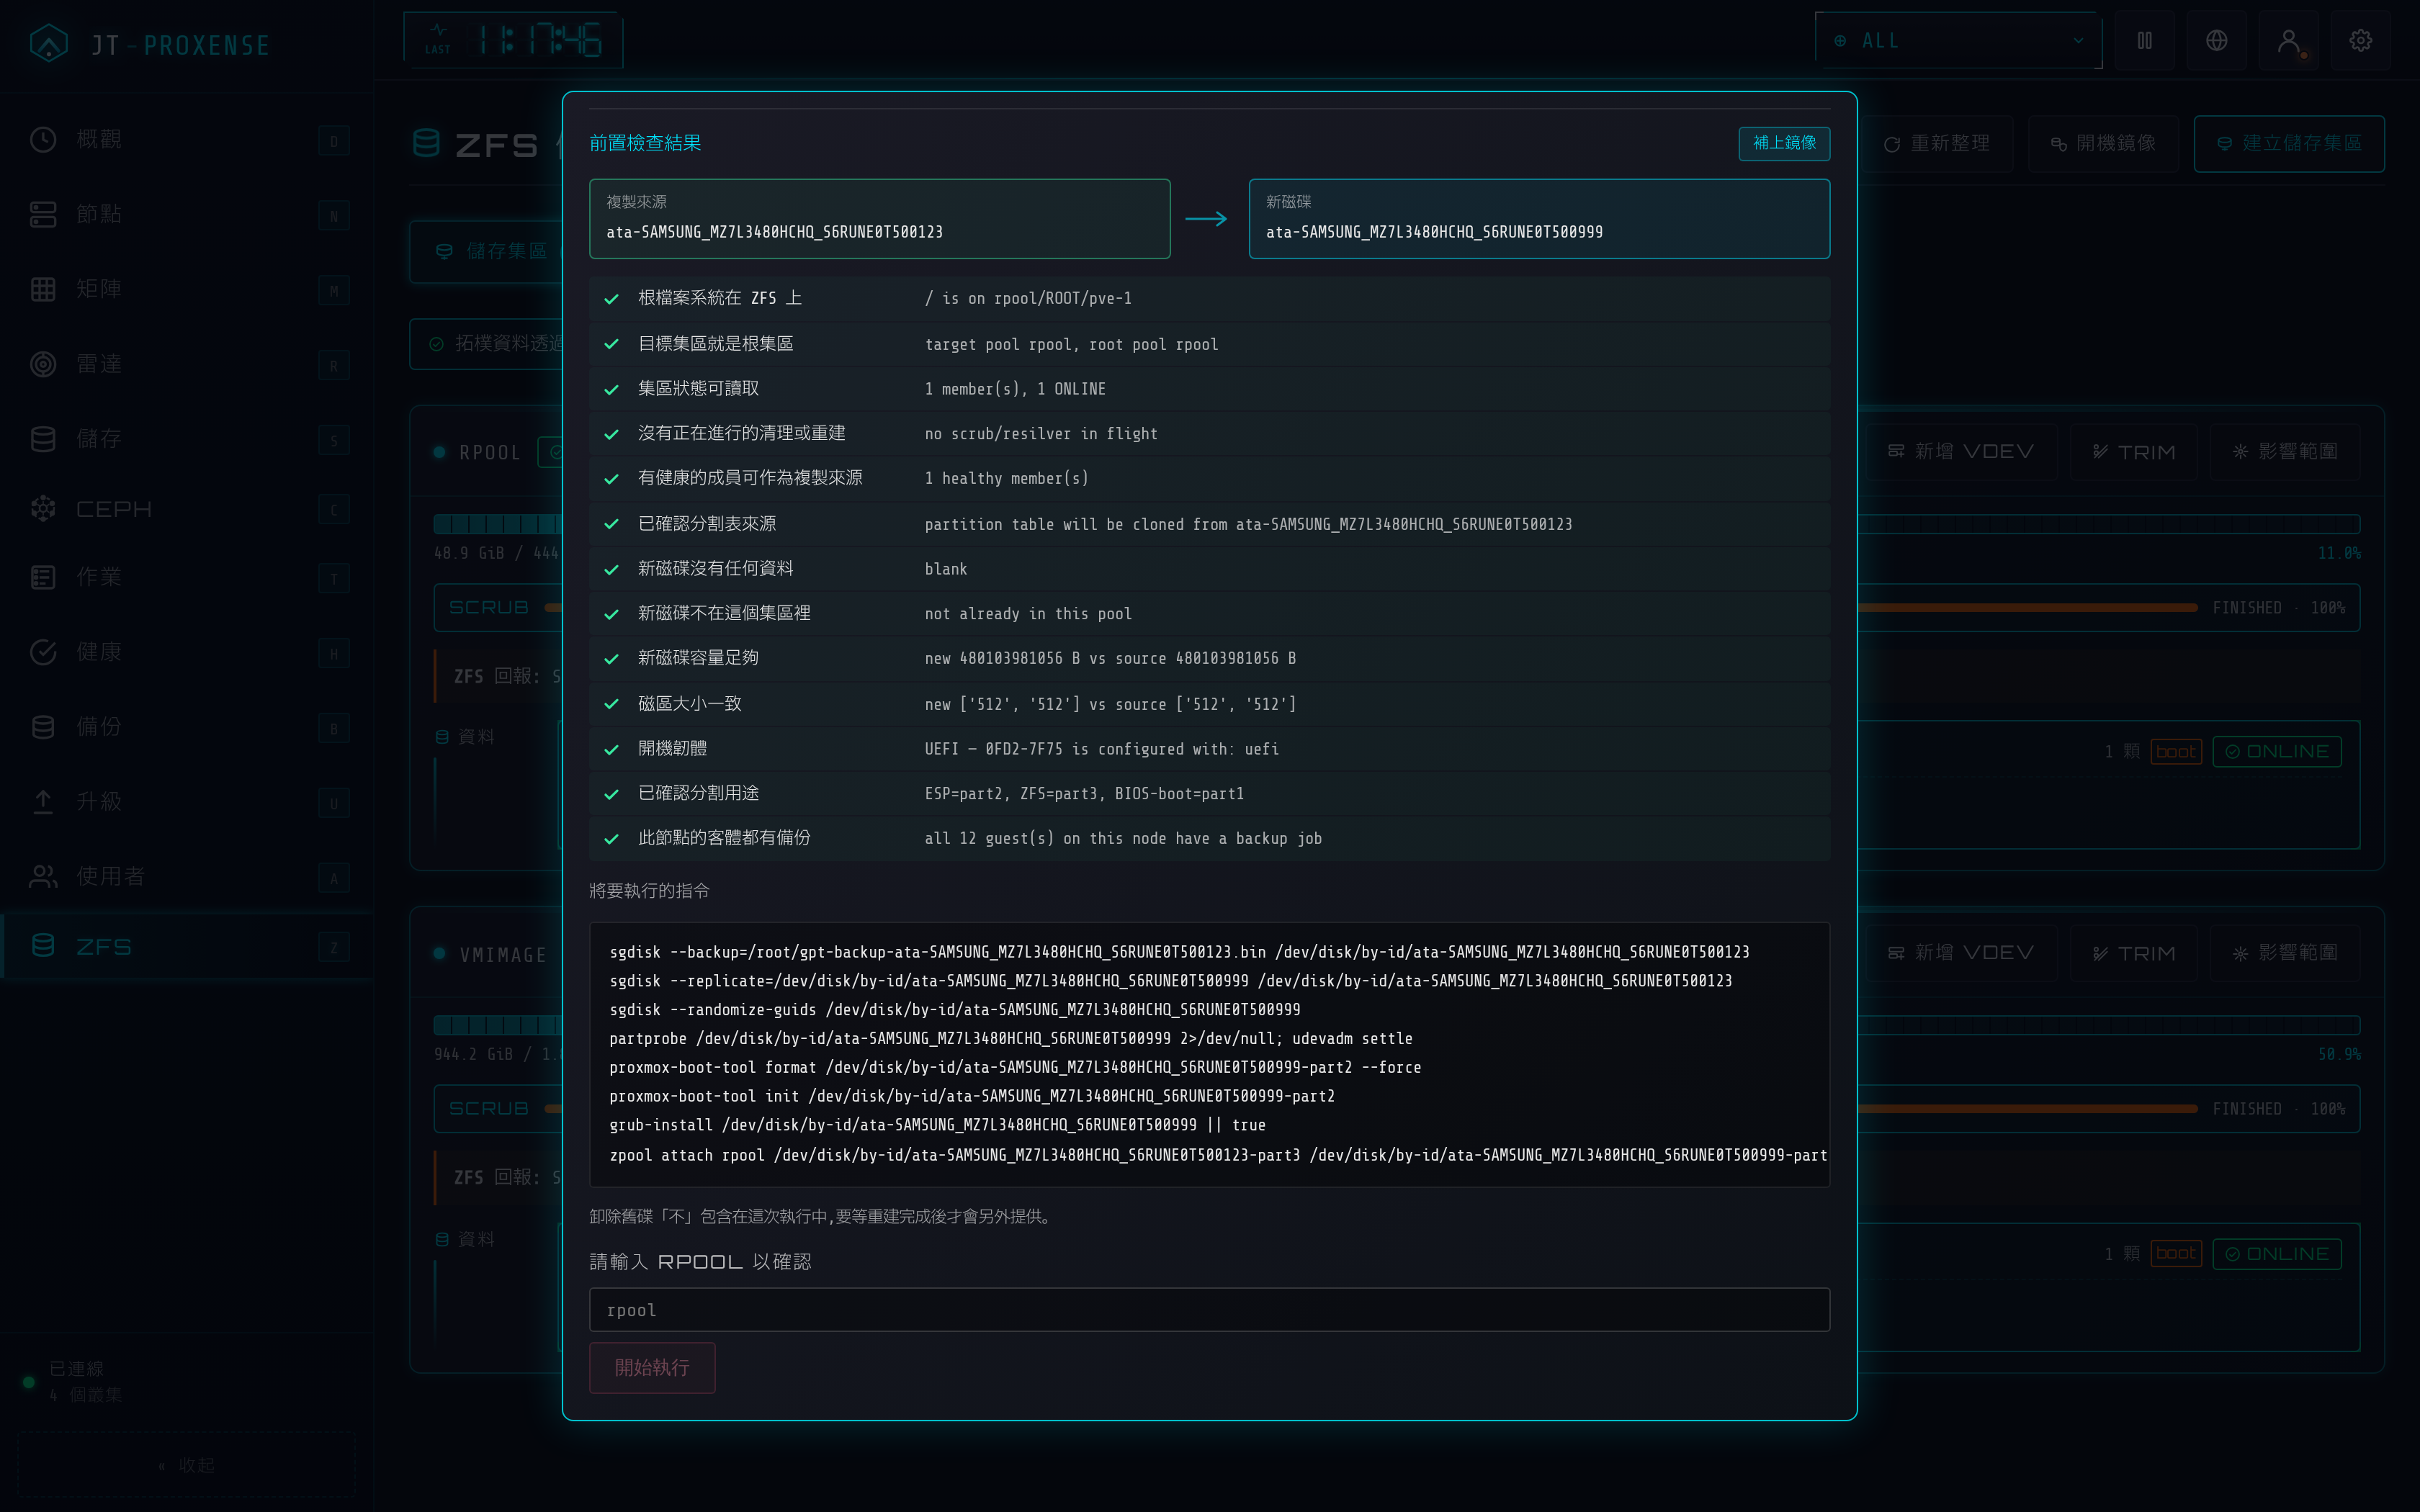
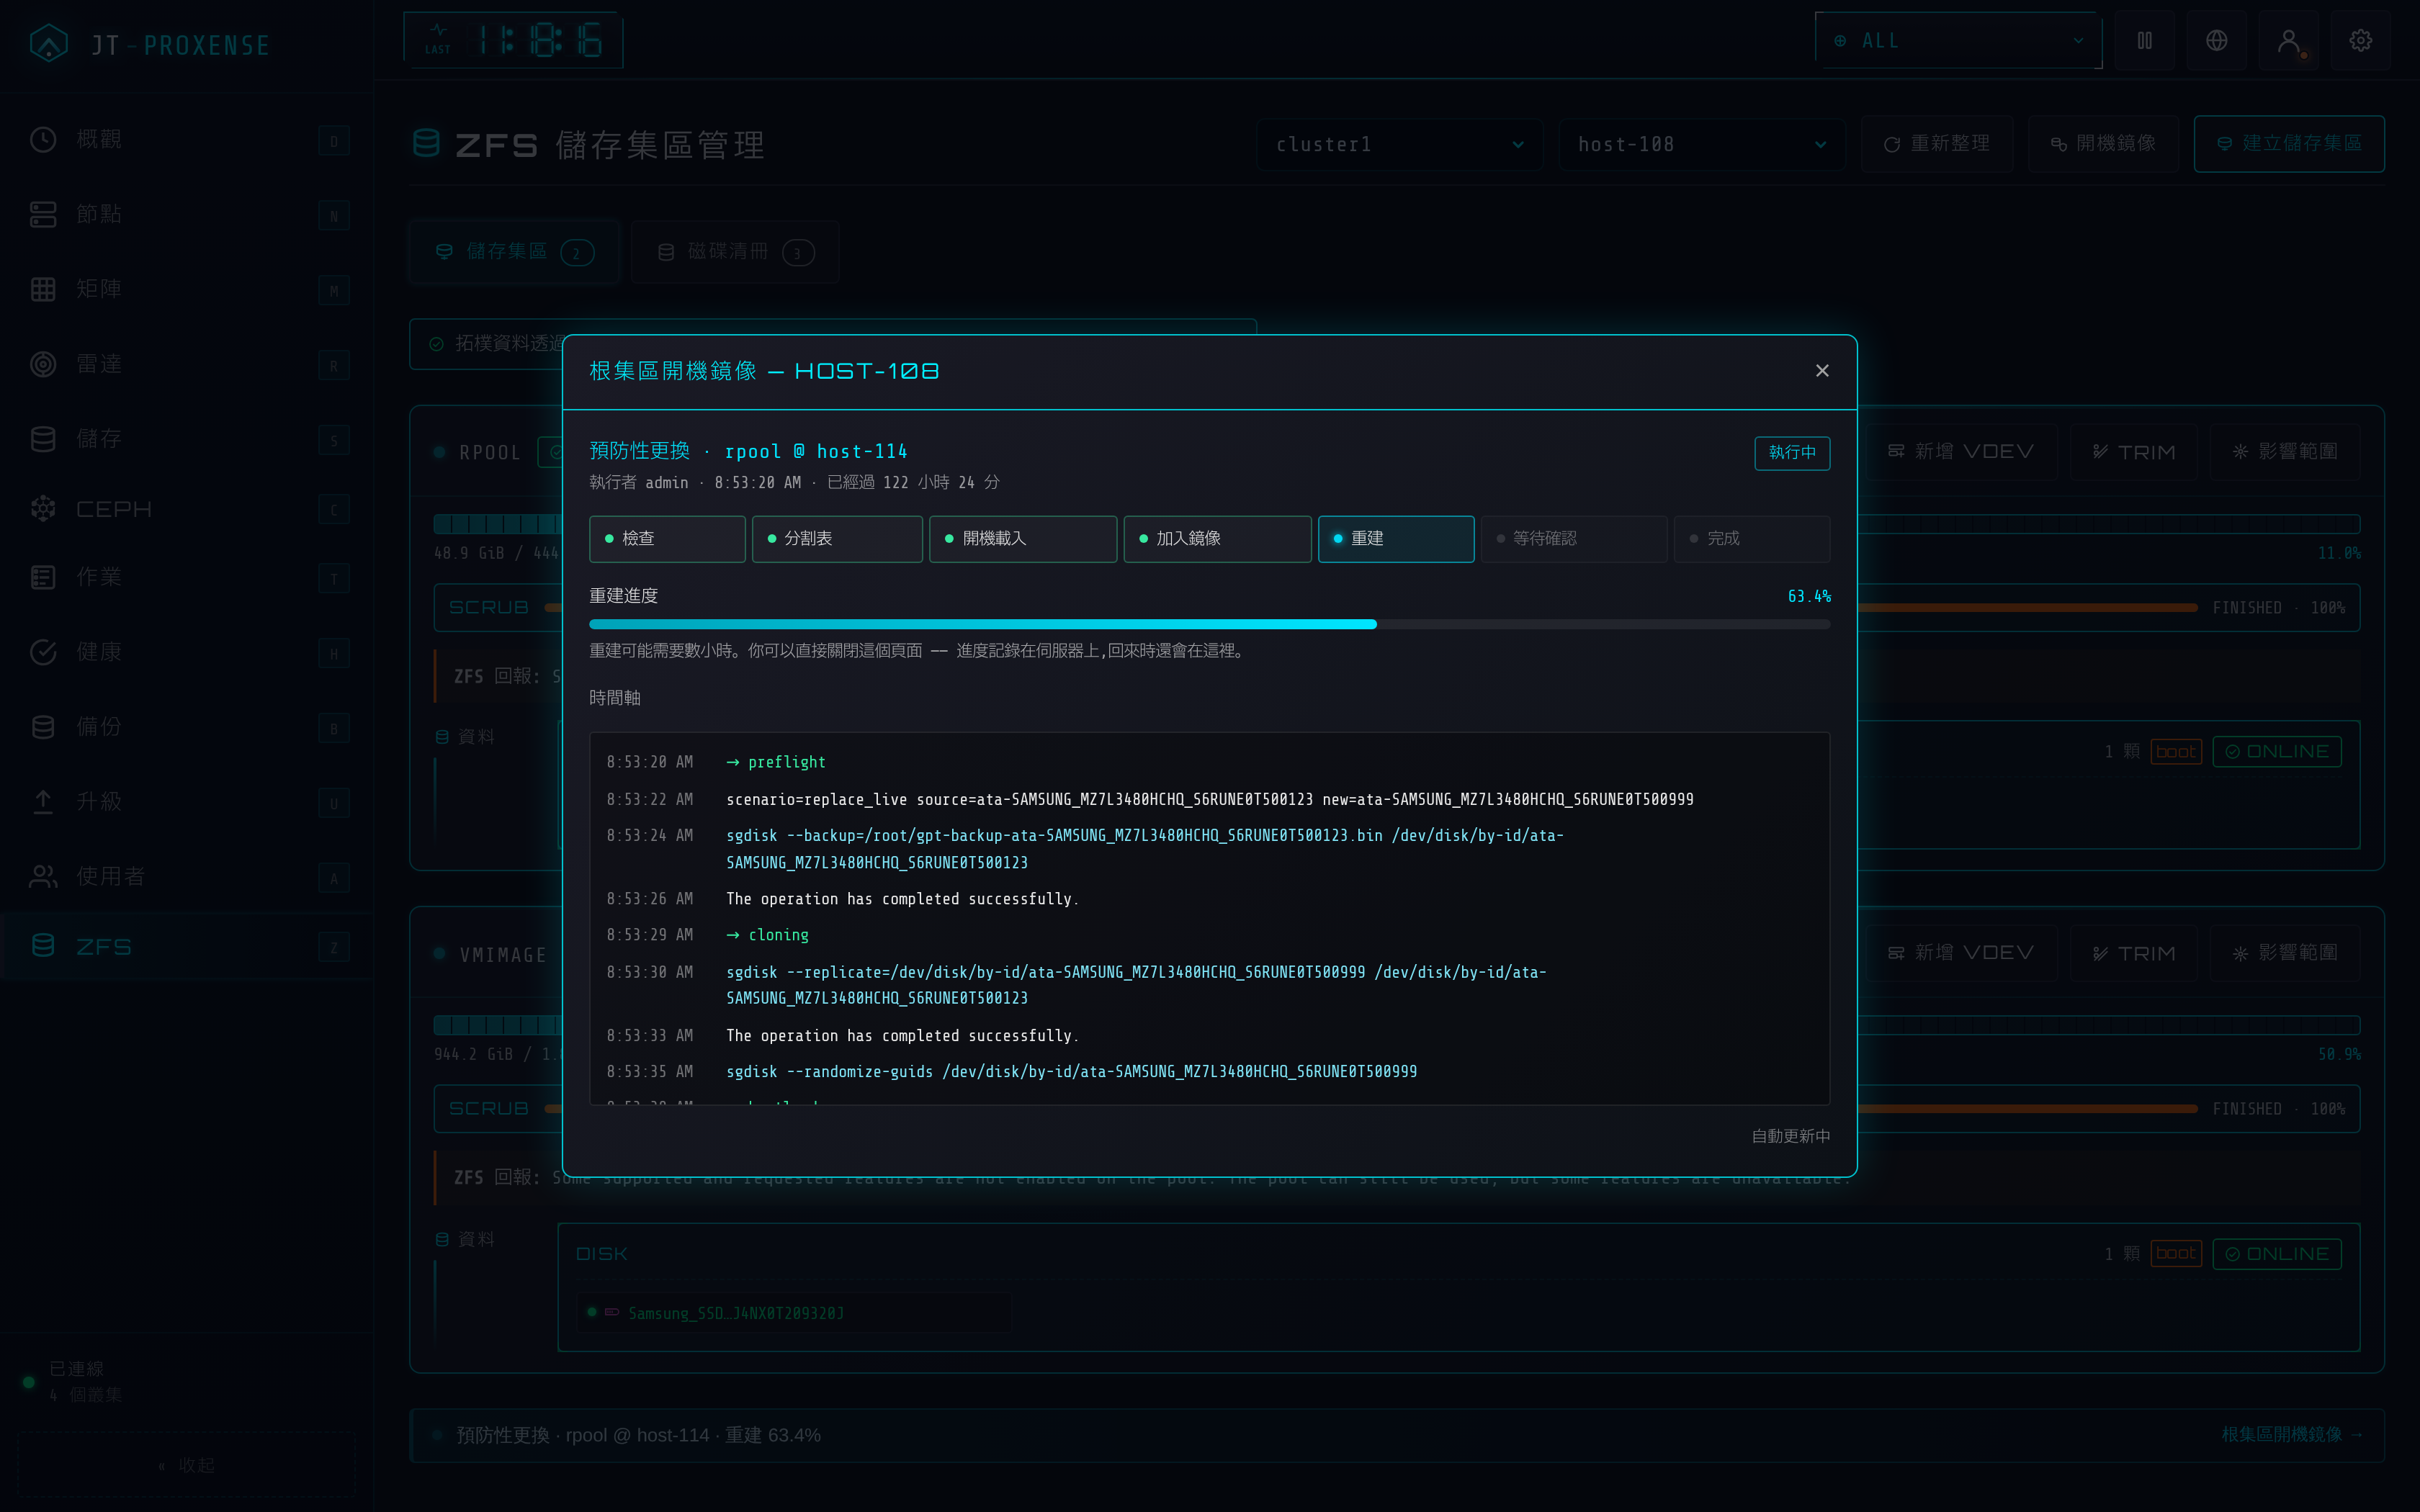
The stock WebUI can create a pool and then leaves you at the CLI forever. This is the other half: replace a disk (including the ESP work a boot disk needs), add vdevs and log / cache / special devices, RAIDZ online expansion, a multi-vdev pool builder, scrub and TRIM, plus a blast-radius view — which PVE storages and guests die with this pool. The topology is drawn, not listed: pool → vdev → individual disks, with HDD/SSD/NVMe marks and redundancy pips showing how many more failures the group can take. Reads go through the PVE API — no SSH, no changes to the node; only maintenance needs SSH, and every action is previewed with ZFS's own dry run and confirmed by typing the pool name.
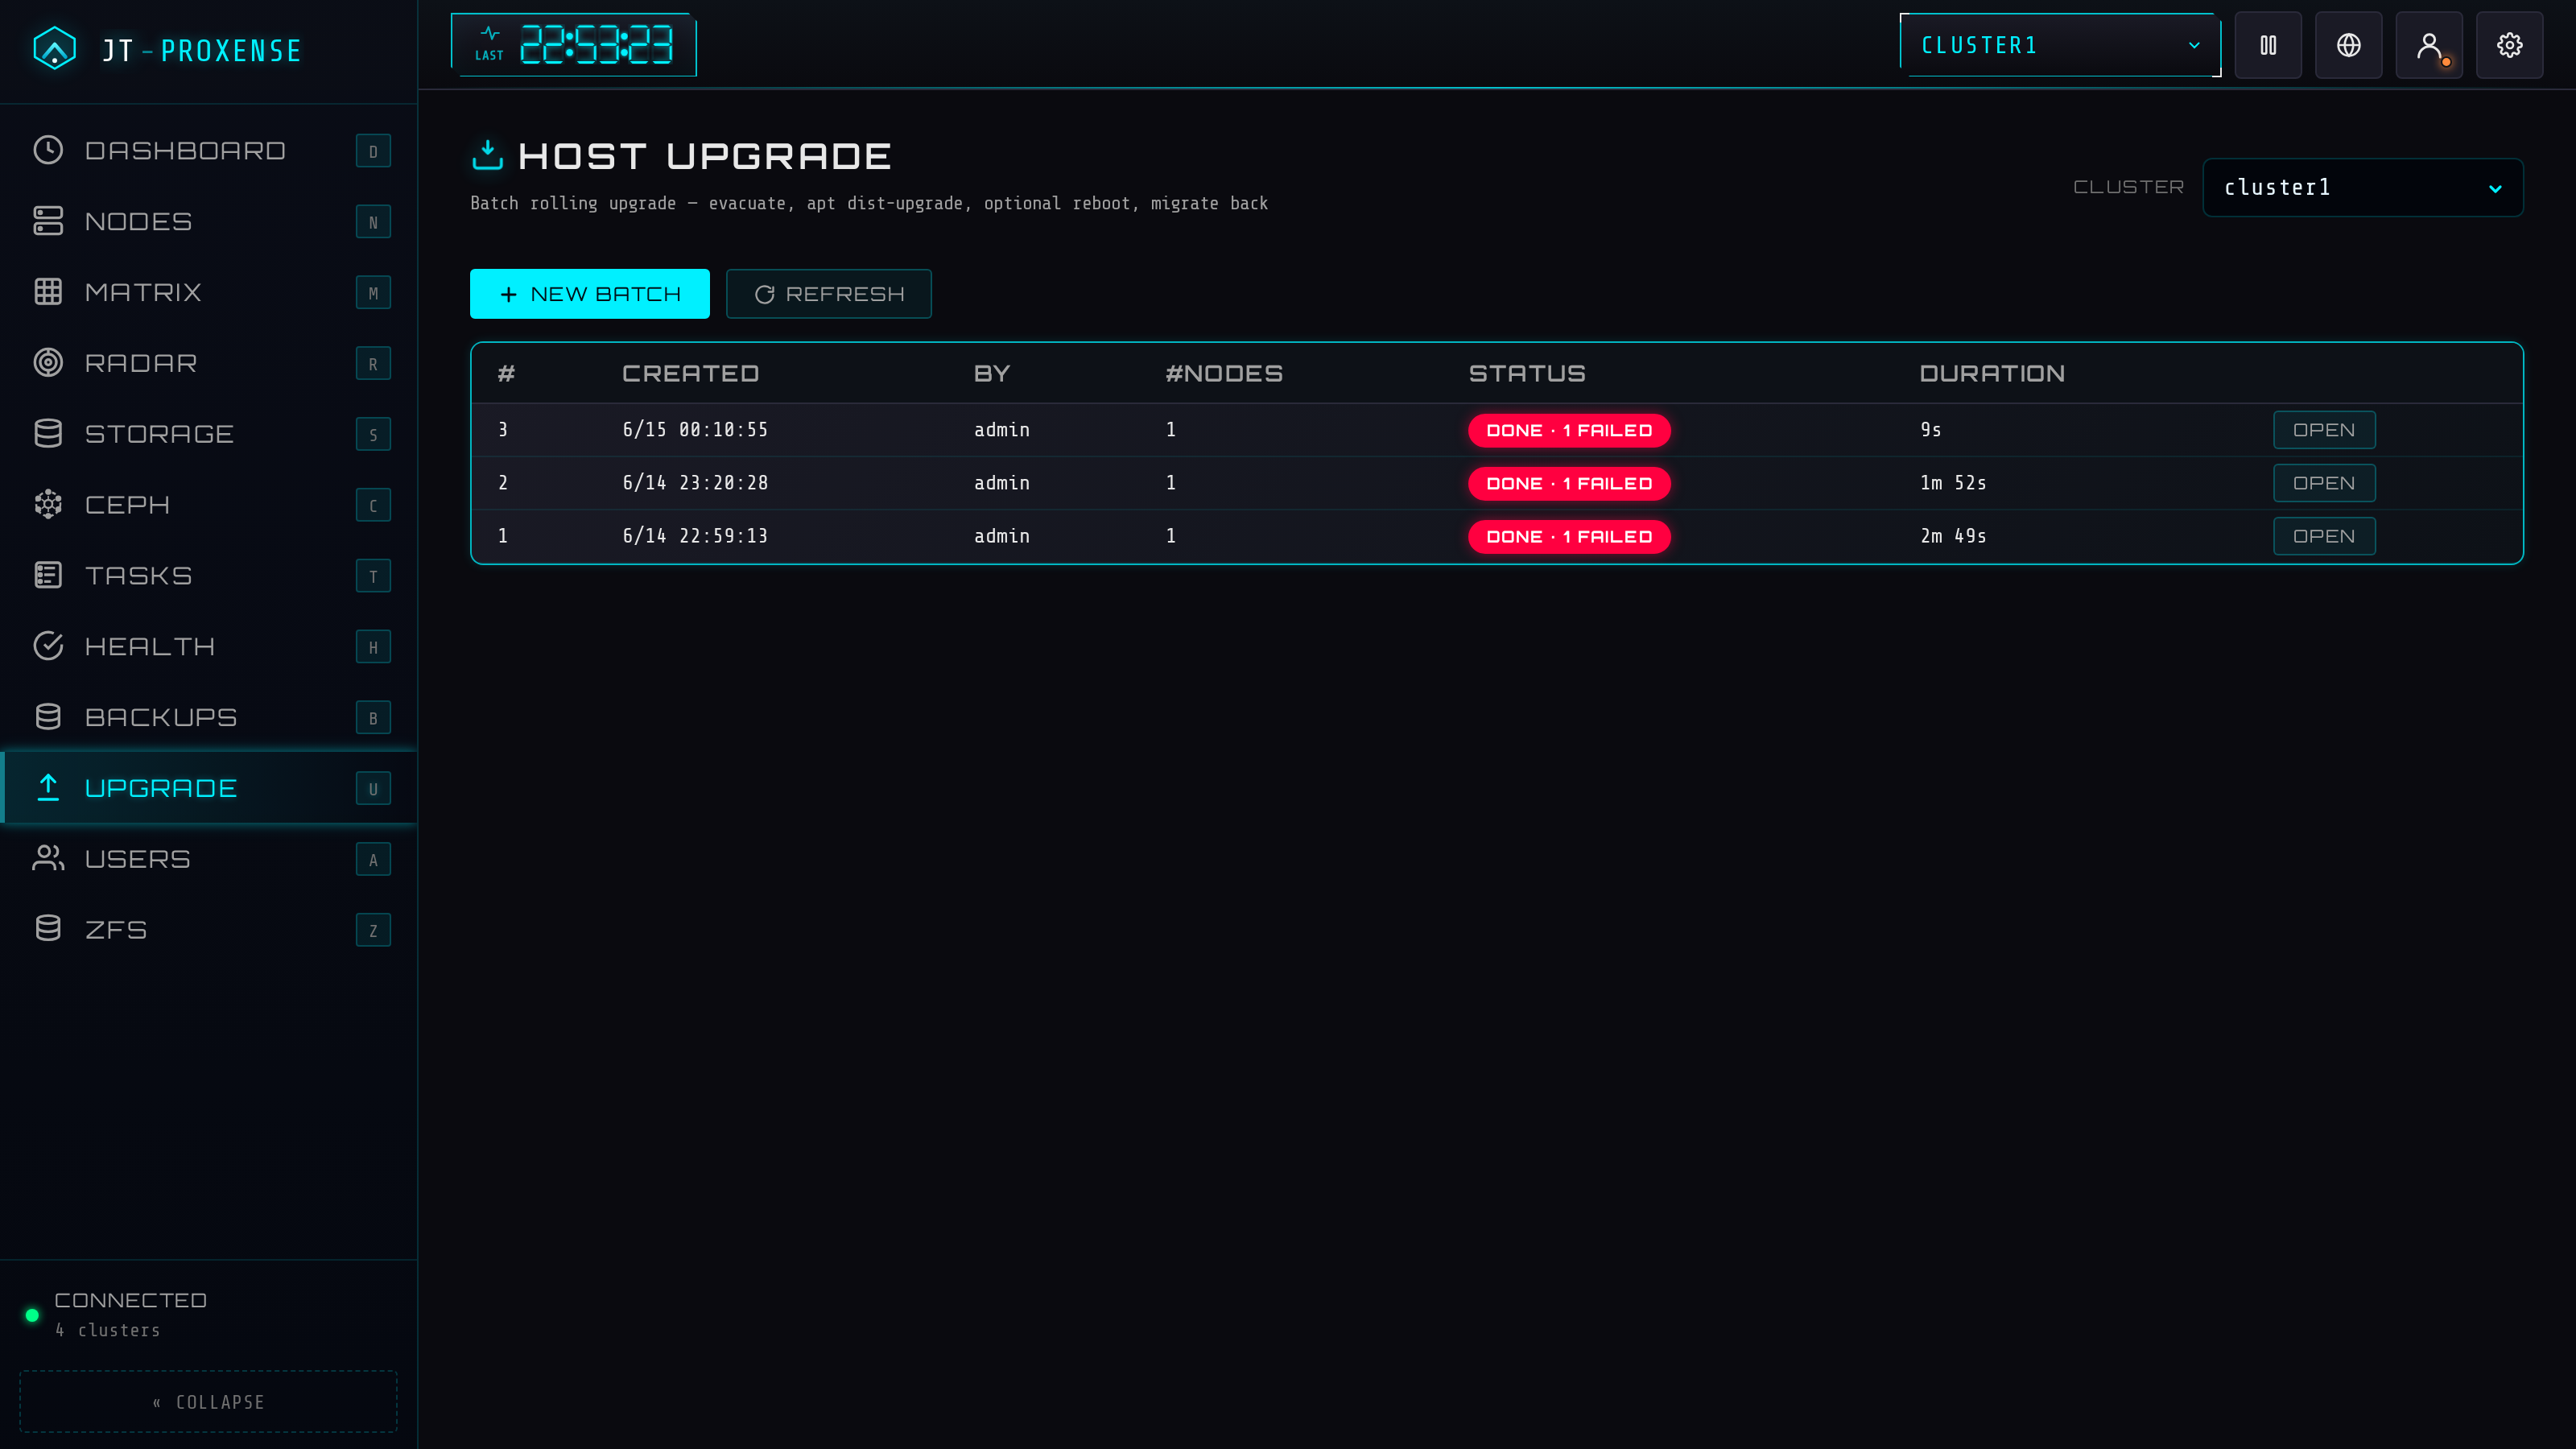
Batch orchestrator: per-host evacuate → apt dist-upgrade (fully unattended) → admin-confirmed reboot → optional migrate-back. Three evac modes (auto / manual / in-place), Ceph-aware (sets noout, waits for all PGs active+clean between hosts), with a live status board that flags any failed node.
Convert a QEMU VM to a VMware/VirtualBox OVA or a Hyper-V VHDX, run on the node over SSH with an internal job queue (conversions outlive the browser tab). Tool auto-install + latest-version check, free-space preflight, streamed download, outputs auto-purged after 24 h.
Per-node network-interface viewer (NIC / bridge / bond link + speed), NTP/chrony config, disks + SMART, services, syslog. One-click SSH-key propagation: authorise one node by hand, fan the host key to the rest over inter-node SSH. Add / remove whole cluster connections from Settings — no config.yaml editing, hot-reloaded.
Click any tile to enlarge. IPs, emails and tokens are blurred.